LTV:CAC Ratio
Every business pays money to get customers, and earns money from those customers over time. The LTV:CAC ratio (pronounced "L-T-V to CAC") compares those two numbers. It tells you whether you are spending smart or burning cash.
Get this ratio right and your marketing budget pays for itself. Get it wrong and you can grow fast and still go broke.
Quick Summary
- LTV (Lifetime Value) is the total revenue one customer brings you before they leave.
- CAC (Customer Acquisition Cost) is what you spend, on average, to win one new customer.
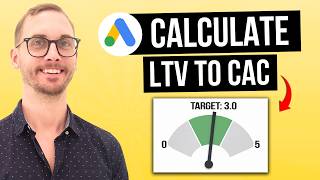
- A healthy LTV:CAC ratio is 3:1 or higher. Below 1:1 means you lose money on every customer.
- Most industries target 3:1 to 5:1. Above 5:1 often means you are underinvesting in growth.
- Improving retention (keeping customers longer) is usually the fastest way to improve your ratio.
What LTV and CAC Actually Mean
LTV, Lifetime Value
LTV (also written CLV or CLTV, all meaning the same thing) is the total net revenue you expect from one customer across the entire time they buy from you.
The simple version of the formula:
LTV = Average Purchase Value x Purchase Frequency x Average Customer Lifespan
For a software subscription business (like a project management app):
- Average monthly plan: $50
- Average customer stays: 24 months
- LTV = $50 x 24 = $1,200
For an e-commerce store:
- Average order value: $80
- Customer orders 3 times per year
- Average customer shops for 2 years
- LTV = $80 x 3 x 2 = $480
LTV is a prediction, not a fact. You are estimating how long a customer will stay and how much they will spend. That means your LTV number is only as good as your retention data. If you do not track churn (the rate at which customers stop buying), your LTV number is a guess.
CAC, Customer Acquisition Cost
CAC is the average amount of money you spend to acquire one paying customer. It includes everything:
- Ad spend
- Salaries of your marketing and sales teams
- Tools and software
- Agency fees
- Content production
- Events
CAC = Total Marketing + Sales Spend / Number of New Customers Acquired
If your company spent $100,000 on marketing and sales last quarter and acquired 200 new customers:
CAC = $100,000 / 200 = $500 per customer
The most common CAC mistake: only counting ad spend and ignoring salaries, tools, and agency fees. If your Google Ads cost $20,000 but you also paid a marketing manager $8,000 and an agency $5,000 to run those ads, your true CAC is based on $33,000, not $20,000. Undercounting CAC makes your ratio look healthier than it is.
The LTV:CAC Ratio
Once you have both numbers, divide them:
LTV:CAC Ratio = LTV / CAC
Using the examples above: LTV of $1,200 and CAC of $500 gives you a ratio of 2.4:1.
That means for every $1 you spend acquiring a customer, you get $2.40 back over their lifetime. The question is: is 2.4:1 good?
What the Numbers Mean
Here is how to read your ratio:
- Below 1:1: You spend more to get a customer than you ever earn back. The business loses money on every sale. Fix this before scaling.
- 1:1 to 3:1: You are profitable per customer, but after overhead (salaries, rent, software) you may be barely breaking even. Common in early-stage businesses or high-competition markets.
- 3:1: The widely accepted benchmark for a healthy, scalable business. Often called the "gold standard." A 2024 study of B2B SaaS companies found the median LTV:CAC ratio sits at 3.2:1.
- 4:1 to 5:1: Strong unit economics. You have room to invest in growth.
- Above 5:1: You may be leaving money on the table. If growth is slow and your ratio is sky-high, you are probably underinvesting in marketing. Your competitors are taking market share while you sit on cash.
Industry Benchmarks (2024 Data)
Research compiled from 2019 to 2024 across 29 industries by First Page Sage shows significant variation by sector:
| Industry | Target LTV:CAC |
|---|---|
| B2B SaaS | 4:1 |
| E-commerce | 3:1 |
| Financial Services | 4:1 |
| Entertainment / B2C SaaS | 2.5:1 |
| Legal Services | 4.5:1 |
| Real Estate | 4:1 |
| Healthcare / Pharma | 4:1 to 5:1 |
The key insight: industries with longer sales cycles and stickier products (B2B SaaS, legal, finance) can justify higher acquisition costs because customers stay longer. High-churn industries (entertainment, B2C apps) need lower CAC to stay profitable.
Real Company Examples
Dropbox: Referrals Slash CAC
In 2008, Dropbox was spending heavily on paid search to acquire users. Their CAC was unsustainably high. They launched a double-sided referral program (both the referrer and the new user got free storage). The results between 2008 and 2010:
- User base grew from 100,000 to 4 million, a 3,900% increase.
- In February 2010 alone, 2.8 million referral invites were sent.
- Referred customers were 37% more likely to retain and had 16% higher LTV than customers from paid channels.
- Permanent signup rate increased by 60%.
By slashing CAC through referrals while simultaneously improving LTV (via higher retention), Dropbox dramatically improved their LTV:CAC ratio without changing their product pricing at all.
Adidas adiClub: Loyalty Doubles LTV
Adidas launched the adiClub loyalty program to improve LTV for repeat customers. By 2024, the program had grown to 240+ million members. Members shop 50% more frequently than non-members and generate double the lifetime value.
That doubling of LTV, without changing CAC, means the LTV:CAC ratio for loyalty-acquired customers is roughly 2x better than for customers without a loyalty relationship.
Worked example: an online fitness app
- Monthly subscription: $30
- Average customer stays 18 months before cancelling
- LTV = $30 x 18 = $540
- Total marketing spend last quarter: $60,000
- New customers acquired: 150
- CAC = $60,000 / 150 = $400
- LTV:CAC ratio = $540 / $400 = 1.35:1
That is dangerously low. Even if every dollar of revenue dropped straight to profit (it won't, there are server costs, staff, etc.), you are barely covering acquisition costs. The fix: either extend average customer lifespan (improve retention/onboarding), reduce CAC (find cheaper channels like SEO or referrals), or raise prices.
The LTV:CAC Improvement Playbook
Ways to Increase LTV
- Improve onboarding. Customers who do not understand the product churn early. A strong first week dramatically extends average lifespan.
- Add upsells (higher-tier plans) and cross-sells (related products). Starbucks Rewards members account for 41% of US sales and hold $1.85 billion in stored value (2025 data). That stickiness is entirely about cross-sell and repeat purchase habits built through the app.
- Segment your best customers. Find the cohort with the highest LTV and replicate it. What channel did they come from? What feature do they use most? Optimize for that.
- Increase price. If you have strong product-market fit, even a 10 to 15% price increase has an outsized impact on LTV.
Ways to Reduce CAC
- Invest in organic channels. A 2024 study found that 68% of the best-performing LTV:CAC ratios were driven by organic marketing (SEO, content, word-of-mouth). Organic traffic has a lower cost per acquisition than paid.
- Build a referral program. As the Dropbox example shows, referred customers both cost less to acquire and stay longer.
- Improve your conversion rate. If your landing page converts at 2% and you lift it to 3%, your CAC drops by 33% with zero change to ad spend.
- Cut channels that do not convert. Measure CAC by channel, not as a blended average. One bad channel can inflate your overall CAC while two good channels look worse than they really are.
The CAC Payback Period
LTV:CAC is the long-run ratio. But cash flow matters too. Even if a customer is worth $1,200 over 24 months, you spent $500 to acquire them today. How long until you recover that $500?
CAC Payback Period = CAC / Monthly Gross Profit per Customer
If a customer pays $50/month and your gross margin (revenue minus direct costs of delivering the product) is 70%:
- Monthly gross profit per customer = $50 x 0.70 = $35
- CAC Payback Period = $500 / $35 = 14.3 months
Benchmark: For SaaS companies, a payback period under 12 months is considered healthy. Between 12 and 18 months is acceptable with strong retention.
Above 24 months is a cash flow strain, especially for venture-funded startups that need to keep acquiring customers before recovering previous CAC spend.
The CAC payback period is particularly important if your business is funded by debt or investor capital. Every month your payback period extends, you need more working capital to keep growing. A shorter payback period means you can reinvest revenue from early cohorts into acquiring new customers, a self-funding growth loop.
Common Mistakes
- Blending CAC across channels. If paid social has a CAC of $800 and SEO has a CAC of $150, your blended CAC of $475 hides the fact that one channel is destroying value. Always measure CAC per channel.
- Using revenue instead of gross profit for LTV. If your product has a 40% gross margin, your effective LTV is 40% of the number you calculate. A $1,200 revenue-LTV with 40% margins is actually $480 in gross profit. Always compare gross-profit LTV to CAC.
- Treating LTV as a fixed number. LTV changes as you change your product, pricing, and retention programs. Recalculate quarterly.
- Ignoring the payback period. A 3:1 LTV:CAC ratio is great on paper. If the payback period is 36 months, you could run out of cash long before you see the return.
- Calculating CAC without sales costs. In B2B, sales team salaries, commissions, and CRM tools belong in your CAC calculation. Leaving them out makes CAC look much lower than it is.
The One-Line Takeaway
If you spend more to get a customer than they ever bring back, no amount of growth fixes it.