Marketing Attribution
Imagine a customer sees your Instagram ad on Monday, reads your blog post on Wednesday, gets a retargeting ad on Friday, and finally buys after clicking your email on Sunday. Which of those four steps actually "caused" the sale?
That question, which marketing touchpoints deserve credit for a conversion, is the entire problem that marketing attribution solves. Attribution is the practice of assigning credit to the channels, campaigns, and content that influenced a customer's decision to buy.
Get it right, and you know exactly where to put your budget. Get it wrong, and you silently waste up to 30% of your marketing spend on things that do not work (Digital Marketing Institute, 2024).
Quick Summary
- Attribution means deciding which marketing touchpoints get credit for a sale or conversion.
- There are seven common attribution models, from simple (last-click) to sophisticated (data-driven).
- 76% of marketers still struggle to determine which channels deserve credit (McKinsey, 2024).
- Companies without proper attribution misallocate up to 30% of their marketing budget.
- The modern best practice is to combine attribution with incrementality testing and marketing mix modeling.
Why Attribution Matters (With Real Numbers)
The marketing attribution software market was worth $4.35 billion in 2024 and is projected to reach $17.73 billion by 2035. That kind of growth signals how seriously businesses now take this problem.
Here is why:
- 57% of companies use some form of attribution model in 2025, but 22% still rely exclusively on last-click (the least accurate model).
- 74% of high-growth companies use multi-touch attribution (which gives credit to multiple steps in the journey).
- Marketers using attribution platforms are 2.3x more likely to increase return on ad spend (ROAS) year over year.
- Data-driven attribution adoption grew 44% year over year between 2023 and 2024.
- Only 29% of marketers are "extremely confident" in the accuracy of their attribution data.
The last stat is the most important. Even with all the tools available today, attribution is genuinely hard, and most teams know it.
Attribution is not just a technical problem. It is a budget problem. When you misattribute credit, you cut spending on channels that are actually working and increase spending on channels that just happened to be last in line. The result is a slow, invisible drain on performance.
The Customer Journey Problem
Before you can understand attribution models, you need to understand why attribution is complicated in the first place.
Modern customers do not buy in a straight line. A typical purchase journey might look like this:
- A person sees your YouTube pre-roll ad while watching a cooking video (they skip it after 5 seconds).
- Three days later, they Google a problem your product solves and find your blog post.
- They follow you on Instagram after reading the post.
- A week later, a retargeting ad on Facebook reminds them of your product.
- They click your email newsletter link and buy.
Five touchpoints. Five different channels. Which one gets credit?
- If you use last-click attribution, email gets 100% of the credit.
- If you use first-click attribution, YouTube gets 100% of the credit.
- If you use a data-driven model, the credit is spread based on what the data says actually influenced behavior.
Each answer leads to a different budget decision. Only one answer is close to the truth.
The 7 Attribution Models Explained
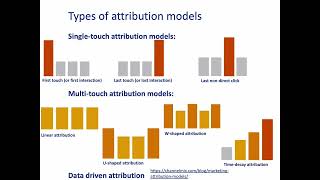
Think of attribution models as different "rules" for splitting the credit pie. Each rule makes different assumptions about what matters most in a customer journey.
1. Last-Click Attribution
Cross-channel paid ad allocation across 20+ digital and offline marketing touchpoints GA's native last-click attribution disproportionately credited bottom-funnel channels, causing mid and top-of-funnel channels like Pinterest and PR to appear ineffective and starving them of budget Implemented Rockerbox multi-touch attribution to track views, clicks, and offline touchpoints across the entire customer journey into a single unified dataset
Result: Scaled total ad spend by 10x while simultaneously doubling ROAS (2x return on ad spend) (Across post-implementation scaling cycles).
SourceWhat it does: Gives 100% of the credit to the very last touchpoint before the conversion.
Best for: Simple campaigns where discovery equals conversion (like a single Google Search ad).
The problem: It completely ignores every touchpoint that came before. In the email example above, YouTube, the blog, Instagram, and Facebook all get zero credit, even though they did real work building awareness and trust.
2. First-Click Attribution
What it does: Gives 100% of the credit to the very first touchpoint.
Best for: Brands focused on measuring awareness and top-of-funnel reach.
The problem: It ignores everything that nudged the customer over the finish line.
3. Linear Attribution
What it does: Splits credit equally across every touchpoint. If there are 5 touchpoints, each gets 20%.
Best for: Teams that want a balanced view without picking favorites.
The problem: It treats a 5-second YouTube ad skip the same as a 10-minute blog post read. Not all touchpoints are equal.
4. Time-Decay Attribution
What it does: Gives more credit to touchpoints that happened closer to the conversion. The email you clicked right before buying gets more credit than the ad you saw two weeks ago.
Best for: Short sales cycles where recent intent matters most.
The problem: Research shows interactions within the final 30 days before purchase can have up to 3x the impact of earlier ones (B2B Marketing Institute), but time-decay can over-apply this logic and completely bury important early touchpoints.
5. Position-Based (U-Shaped) Attribution
What it does: Gives 40% of credit to the first touchpoint, 40% to the last touchpoint, and splits the remaining 20% across everything in between.
Best for: Teams that value both discovery and conversion equally.
The problem: The 40/20/40 split is arbitrary. It is a guess dressed up as a formula.
6. W-Shaped Attribution
What it does: A variation of position-based. Gives 30% to the first touch, 30% to the "lead creation" touch (when a visitor becomes a known contact), 30% to the final touch before close, and splits 10% across the rest.
Best for: B2B companies with long sales cycles where lead generation is a distinct milestone.
7. Data-Driven Attribution
What it does: Uses machine learning (an algorithm that learns from patterns in data) to figure out how much each touchpoint actually influenced the final decision. It does not use a preset rule; it analyzes thousands of conversion paths to find what truly moves the needle.
Best for: Any account with enough data (Google Ads requires a minimum of 3,000 conversions per month for its data-driven model to work).
The catch: It is a "black box", you cannot always see why the model assigned credit the way it did.
Real Example, Skincare Brand Discovery: A direct-to-consumer skincare brand ran a test comparing first-touch vs. last-click attribution. Last-click gave almost all credit to email campaigns (the final step before purchase). But first-touch attribution revealed that educational blog content was actually introducing 40% of their highest-value customers, customers who would have never found the brand without it. By shifting budget toward content production, they improved overall customer acquisition quality while keeping email as a conversion driver.
Attribution Model Comparison at a Glance
The Modern Problem: Walled Gardens
Here is something most beginner guides do not tell you: every ad platform measures attribution differently, and each one tends to over-report its own results.
Say you run ads on both Facebook and Google. Facebook reports 250 conversions. Google reports 280 conversions. You assume you had 530 total conversions. But your actual sales numbers show only 300 orders.
That gap, 530 reported vs. 300 actual, is called "double counting." Both platforms claimed credit for the same 230 customers. This is the "walled garden problem": Facebook can only see what happens on Facebook, and Google can only see what happens on Google. Neither can see the full picture.
For every ad click, there are an estimated 10 to 50 impressions (views without clicks) that shape purchase decisions but never show up in any attribution report.
Never add up conversion numbers across platforms and treat the total as your real result. Facebook's 250 + Google's 280 does not equal 530 real customers. Check against your actual order count (from your CRM or e-commerce platform) to find the truth. Platform-reported numbers are always inflated.
The Three-Layer Measurement Framework
Performance marketing and paid social portfolio allocation exceeding $25M in annual media spend Conflicting in-platform ad metrics and last-click attribution overstated performance on existing demand and caused blended CAC to surge Deployed Rockerbox Marketing Mix Modeling (MMM) alongside attribution to isolate true incremental channel lift and reallocate spend away from non-incremental touchpoints
Result: Cut social and performance CAC by 30% while driving a 5–10% lift in total conversions and enabling a 10–20% increase in total ad spend (Over annual model calibration cycles).
SourceThe best marketing teams in 2025 do not rely on attribution alone. They use three complementary methods together:
Layer 1: Attribution Tracks observed behavior, which channels a customer touched before converting. Good for understanding channel patterns. Weak when channels overlap or when impressions are not tracked.
Layer 2: Incrementality Testing Runs experiments (like holdout tests, where a random group of customers sees no ads) to measure the true causal impact of a channel. Answers the question: "Would this customer have bought anyway, even without seeing our ad?" This is the gold standard for proving a channel is actually driving growth.
Layer 3: Marketing Mix Modeling (MMM) Analyzes aggregate (total) data across all channels over time, accounting for seasonality, economic factors, and offline effects. Does not need cookies or individual-level tracking. Useful for big-picture budget planning.
Using all three together, rather than relying on any one method, gives you the most accurate picture of what is actually working.
Real-World Impact: What Good Attribution Unlocks
Gartner research found that companies using advanced attribution models achieve 15-30% lower customer acquisition costs and up to 40% improvement in marketing ROI compared to companies using simple last-click models.
Google Marketing Platform data shows that companies using AI-powered attribution see an average 27% improvement in campaign performance across channels.
These are not small gains. For a company spending $1 million per year on marketing, a 27% improvement means getting $270,000 more value from the same budget without spending an extra dollar.
How to Choose the Right Model
Here is a practical decision guide:
- Just getting started? Use last-click for simplicity, but run a parallel comparison with linear attribution so you can see what you are missing.
- Short sales cycle (under 7 days)? Time-decay attribution is a reasonable choice.
- Long sales cycle (weeks or months)? Position-based or W-shaped models respect both early awareness and late-stage conversion.
- B2B with a CRM (like Salesforce or HubSpot)? W-shaped attribution aligns with your sales funnel stages.
- High volume, data-mature team? Move to data-driven attribution in Google Analytics 4 or a dedicated attribution platform.
- Want the truth, not a model? Layer in incrementality testing alongside whatever attribution model you use.
Common Mistakes to Avoid
- Trusting platform numbers as ground truth. Always reconcile against your actual order or CRM data.
- Setting attribution windows too short. GA4's default 90-day window is often too short for B2B sales cycles that can take 6-12 months.
- Choosing a model because it makes your favorite channel look good. Pick a model based on your sales cycle and business goals, not based on what flatters your current strategy.
- Ignoring offline touchpoints. 64% of shoppers research online before buying offline. If you only track digital channels, you are missing a huge part of the picture.
- Changing models too often. Switching attribution models mid-campaign makes trend data meaningless. Pick a model, run with it for at least a quarter, then evaluate.
The One-Line Takeaway
The channel that gets the last click is rarely the channel that deserves the most credit: stop letting your measurement model steal from your best-performing channels.