Imagine 1,000 people visit your website. Only 26 buy something. Where did the other 974 go? Funnel analysis is the discipline of answering that exact question, finding the leaks, fixing them, and turning more visitors into customers.
Quick Summary
- A marketing funnel tracks the steps a user takes from first hearing about you to buying from you.
- Funnel analysis finds the stages where the most people drop off.
- The average funnel converts just 3.1% of visitors, the top 10% of optimized funnels convert at 9.2% (2025 data).
- You need both numbers (how many dropped off) and context (why they dropped off).
- Small fixes at high-drop stages produce outsized revenue gains.
What Is a Marketing Funnel?
A marketing funnel is a model that shows the journey a person takes from stranger to customer. It is called a "funnel" because many people enter at the top but only a few make it all the way through to a purchase.
The classic funnel has four stages:
- Awareness, The person learns you exist (sees an ad, finds you on Google, hears about you from a friend).
- Interest, They want to know more (read your blog, watch your video, browse your product page).
- Decision, They are seriously considering buying (compare prices, read reviews, add to cart).
- Action, They buy, sign up, or complete the goal.
This is often abbreviated as AIDA (Awareness, Interest, Decision, Action).
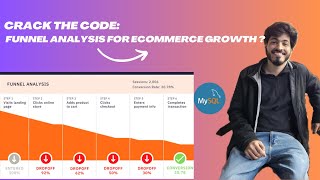
Different businesses use different funnel shapes. A SaaS company might track: Visitor → Free Trial → Active User → Paid Customer. An e-commerce store might track: Landing Page → Product Page → Add to Cart → Checkout → Purchase. The stages should match your actual customer journey, not a generic template.
What Is Funnel Analysis?
Funnel analysis means measuring how many people move from one stage to the next, and investigating why people drop off where they do.
It answers three questions:
- Where are people leaving the funnel?
- How many are leaving at each stage?
- Why are they leaving?
The first two are answered with data from tools like Google Analytics 4 (GA4), Mixpanel, or Amplitude. The third requires qualitative data like session recordings, heatmaps, and user surveys.
The Funnel Analysis Process (5 Steps)
Step 1, Define Your Funnel Stages
Before you open any analytics tool, write down the exact steps a user must complete to reach your goal. Be specific. "Visit website" is too vague. "Lands on homepage" is better. "Clicks the pricing link from homepage" is best.
Each step should be:
- A single, discrete action
- Something your analytics tool can actually track
- In the order users naturally take them
Step 2, Collect Data Per Stage
Set up tracking for each stage in your analytics tool. In GA4, this is called a "Funnel Exploration" report. You input each step as an event (a tracked action), and GA4 shows you how many users completed each one.
Key numbers to capture per stage:
- Total users who entered that stage
- Total users who completed that stage
- Time taken at that stage
Step 3, Calculate Drop-off Rates
The drop-off rate (also called the abandonment rate) at each stage is:
Drop-off Rate = (Users who entered, Users who completed) / Users who entered x 100
For example: 500 people add a product to the cart. Only 200 reach checkout. Drop-off rate = (500, 200) / 500 x 100 = 60%.
The conversion rate is the inverse: 200 / 500 = 40% conversion rate for that stage.
The stage with the biggest drop-off is your biggest opportunity.
Step 4, Investigate the Biggest Drops
An online lighting retailer selling to US and Canada customers, working with VWO Services on a full-funnel optimization program Checkout conversion was underperforming, and the team suspected the problem wasn't only on the checkout page itself Used heatmaps, scrollmaps, and session recordings across the whole funnel, not just checkout, to find friction on the homepage and product listing pages that was preventing visitors from ever reaching checkout
Result: 125% increase in checkout conversion rate and an 18x return on the optimization program's investment (18-month full-funnel optimization engagement).
SourceNumbers tell you where the problem is. You need additional tools to understand why. Common investigation methods:
| Tool | What It Shows |
|---|---|
| Heatmaps (Hotjar, Microsoft Clarity) | Where users click and where they ignore |
| Session recordings | Exact mouse movements and rage-clicks |
| Exit surveys | User's own words about why they left |
| A/B tests | Which version of a page converts better |
Real case: Converica (e-commerce, 2024)
Converica ran funnel analysis on their checkout flow and found a sharp drop-off at the payment page on desktop. They investigated with session recordings and found users were hesitating at shipping costs. They tested adding "Free shipping on orders over $50" messaging directly on the cart page. The result: a 27% increase in desktop order completion and a 60.3% increase in revenue per visitor. Note that the same fix had no effect on mobile, which is why segmenting by device is critical.
Step 5, Test a Fix and Measure
Once you have a hypothesis (a specific guess about why users drop off), test it. Change one thing at a time. Run an A/B test if your traffic volume allows it (you need at least 100+ conversions per variant to get statistically reliable results).
After the test, go back to Step 3 and recalculate. Funnel optimization is a loop, not a one-time project.
Key Metrics in Funnel Analysis
Stage-Level Metrics
- Stage Conversion Rate: The percentage of users who move from one step to the next. A healthy e-commerce cart-to-checkout rate is typically 40-60%.
- Stage Drop-off Rate: The inverse of conversion rate. Tells you what percentage you are losing.
- Time in Stage: How long users spend at each step. Very long times can mean confusion or hesitation.
Overall Funnel Metrics
- Overall Funnel Conversion Rate: The percentage of users at the top of the funnel who complete the final goal. The industry average across all sectors was 3.1% in 2025. The top 10% of optimized funnels reached 9.2% (source: Amra and Elma, 2025 data), and more recent 2026 benchmark reports put the median site conversion rate at roughly 2.35%, with top performers still pulling well ahead of the pack.
- Customer Acquisition Cost (CAC): How much you spend in marketing and sales to get one customer. If you improve your funnel conversion rate, your CAC drops even if your ad spend stays the same.
- Pipeline Velocity: How fast users move through the funnel from first touch to conversion.
B2B vs B2C benchmarks differ significantly. B2B funnels typically convert at 1-5% because purchase decisions involve multiple stakeholders and longer buying cycles. B2C funnels often reach 5-15% because individual consumers make faster, lower-risk decisions. Always compare your numbers to your own industry, not the global average.
Funnel Segmentation: The Most Underused Technique
Jitsi.org, the video-conferencing product owned by 8x8, analyzed with Amplitude's funnel and segmentation tools The aggregate funnel number looked ordinary and gave no indication that one specific user group was converting far better than the rest Segmented the funnel by acquisition path and found that users who installed the Chrome extension converted and retained at meaningfully higher rates than the overall average, then promoted the extension more prominently to steer more users into that path
Result: Doubled Day 7 retention rate after promoting the higher-converting Chrome extension path (Reported in Amplitude's funnel analysis case study collection).
SourceMost marketers look at their funnel as one number. Smart marketers break it into segments.
Segmentation means splitting your funnel data by a variable like:
- Traffic source (organic search vs paid ads vs email vs social)
- Device type (mobile vs desktop vs tablet)
- User type (new visitor vs returning visitor)
- Geography (country or city)
- Product category
The Converica case above is a perfect example: overall checkout conversion looked acceptable, but breaking it down by device revealed a desktop-specific problem that was masking a major revenue leak.
When you see a big difference between segments, you have found a specific, actionable problem.
Real-World Examples
Example 1: SaaS Academy Reduces No-Shows (2024)
SaaS Academy, a coaching business for software founders, ran funnel analysis on their sales demo pipeline. They identified a specific drop-off: prospects who booked a demo frequently did not show up (no-shows). This was a mid-funnel leak between "demo booked" and "demo completed."
Their hypothesis: people forgot or deprioritized the demo between booking and the call date.
Their fix: automated SMS reminders before the demo.
Result: demo no-shows dropped by approximately 20%, generating an estimated $90,000 in additional monthly revenue. The fix took less than a day to implement.
Example 2: Companies with Aligned Sales and Marketing Teams
Research from HubSpot analyzed thousands of businesses and found that companies where the sales and marketing teams share the same funnel data and definitions experience 67% higher sales funnel conversion rates and generate 208% more revenue from marketing efforts.
The insight: funnel analysis only works when every team agrees on what each stage means and who is responsible for it.
Open vs Closed Funnels
You will encounter two funnel types in analytics tools.
Closed funnel, Users must enter at Step 1 and go through steps in order. If someone jumps directly to Step 3, they are excluded from the data. Use this when you want to measure a specific, linear flow (like a 4-step checkout).
Open funnel, Users can enter at any step. This is more realistic for most web journeys, because users often land on a product page directly from a Google search, skipping your homepage entirely. GA4 supports both types in its Funnel Exploration report.
Common mistake: using a closed funnel when your users skip steps.
If 40% of your e-commerce visitors land directly on product pages (bypassing your homepage and category pages), a closed funnel starting at the homepage will make your funnel look far worse than it is. It will appear that only 60% of users even enter the funnel, when in reality 100% are in the funnel, just entering at different points. Always check your traffic sources before choosing closed vs open funnel analysis.
Tools for Funnel Analysis
| Tool | Best For | Cost |
|---|---|---|
| Google Analytics 4 | Website and e-commerce funnels | Free |
| Mixpanel | Product and app funnels | Free tier available |
| Amplitude | Advanced behavioral funnels | Free tier available |
| Hotjar | Heatmaps + session recordings alongside funnel data | Free tier available |
| Microsoft Clarity | Heatmaps and recordings | Free |
| Usermaven | SaaS and product-led funnels | Paid |
For most beginners, Google Analytics 4 + Hotjar (both free tiers) cover 90% of use cases.
The One-Line Takeaway
Find the single step where most people leave your funnel, fix that one thing before touching anything else.