Funnel Analytics
Most growth problems are not traffic problems. They are leak problems. Funnel analytics is the discipline of measuring each step a user takes toward a goal, finding the stage with the biggest drop, and fixing that step before spending another dollar on ads. If you are a PM, performance marketer, or growth lead, this is the report you should open first every Monday.
What It Actually Is
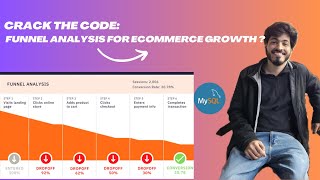
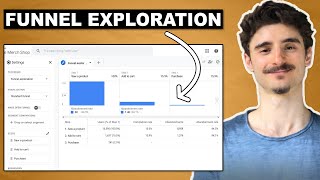
A funnel is an ordered sequence of events that ends in a conversion: visit, view product, add to cart, start checkout, purchase. Funnel analytics measures the count of users at each step and the conversion rate between steps. The point is not the final number. The point is the gap between two adjacent steps, because that gap is where you can intervene.
Concrete example: a SaaS site has 10,000 landing-page visits, 1,200 sign-ups, 480 activated accounts, and 96 paying customers. The overall visit-to-paid rate is 0.96 percent. But the steepest drop is sign-up to activation (60 percent leave). That is your leak, not the homepage.
Why It Matters (with data)
Funnel benchmarks vary wildly by stage and industry, which is exactly why averages mislead and stage-level analysis wins.
- The average sales funnel conversion rate across industries sits around 2.35 percent, with top performers above 5.31 percent (Amra and Elma, 2026).
- B2B SaaS landing pages average a 1.1 percent conversion in the 2025 First Page Sage study, and the MQL-to-SQL step is the single steepest loss at 15 to 21 percent. Improving that one stage by five points can lift revenue by up to 18 percent (First Page Sage, 2025).
- Ecommerce sites typically see add-to-cart at 8 to 10 percent of product views and checkout-to-purchase around 45 to 50 percent, so the biggest absolute losses usually sit at the product-view to cart step (Growers Marketing).
The pattern: one or two stages do almost all the damage. Fix those, ignore the rest.
How It Works / The Playbook
- Define the funnel as events, not pages. Use action names like
signup_completed,activation_event,checkout_started. Pageviews lie when users come back later or jump steps. - Pick a fixed window. Same cohort, same date range, same device split. Comparing a 30-day funnel to a 7-day funnel is how you lie to yourself.
- Compute step-to-step conversion, not just end-to-end. The end-to-end number tells you the score. The step rates tell you what to do.
- Rank stages by absolute users lost, not by percent. A 10 percent drop on a 100,000-user step matters more than a 50 percent drop on a 500-user step.
- Segment the leakiest step. Break it down by source, device, country, and new vs returning. The leak is almost always concentrated in one segment.
- Form a hypothesis, then run one test. Bad checkout copy? Hidden shipping? Slow page? Pick one. Ship one A/B test. Measure the same step.
- Re-rank after the fix. The new bottleneck is rarely where the old one was.
An online store ran a funnel drop-off analysis and found a sharp loss between product view and checkout. The cause was shipping costs that only appeared late in checkout. They added a badge on every product page showing progress toward the free-shipping threshold, reframing the cost as a reward. The result: a 27 percent lift in desktop order completion and a 60.3 percent increase in revenue per visitor (Krish TechnoLabs).
Common Mistakes
- Measuring only the final conversion rate. You see the score but never the play that lost the game.
- Using pageviews instead of events. A user who refreshes, comes back tomorrow, or deep-links past a step destroys page-based funnels.
- Comparing your funnel to a generic industry average. B2B SaaS, PLG SaaS, and ecommerce funnels are different shapes. Use stage-level benchmarks from your category.
- Optimizing the top of the funnel because it has the most traffic. Cheaper wins almost always sit two or three steps deeper, where intent is higher.
- Running five tests on five steps in parallel. You will not know which fix caused which lift.
Key Takeaways
- The leak is usually one or two specific steps, not the whole funnel. Rank by absolute users lost and start there.
- Event-based funnels with fixed cohorts beat pageview funnels every time.
- A five-point lift on the worst step often beats a doubling of paid traffic, and costs nothing in media.