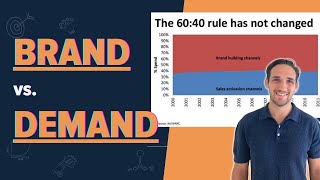
Brand vs. Demand: Why You Need Both to Grow
In 2024, the average brand spent 68.8% of its marketing budget on short-term performance tactics, the mirror image of what the evidence says produces the highest long-term ROI. Understanding why this gap exists, and how to close it, is one of the highest-leverage moves a marketer can make in 2025.
Quick Summary
- The Binet and Field framework, built on 996 IPA effectiveness cases, recommends a 60% brand / 40% demand split for most consumer brands.
- Transitioning from performance-only to a balanced brand-plus-demand approach is associated with a 90% average ROI uplift over three years (WARC Multiplier Effect, 2024).
- Going in the opposite direction, cutting brand to fund performance, produces an average 40% ROI decline over the same window.
- At any given moment, only 3-5% of your total addressable market is actively buying. Demand generation fights over that 3-5%. Brand building shapes the other 95%.
- Measurement gaps, not strategic disagreement, are the primary reason most organisations skew toward performance spend. Fixing measurement is the first step.
What It Actually Is
Brand building is marketing that creates mental availability: the probability that someone thinks of your brand when a purchase situation arises, even if that purchase is weeks or months away. It works through emotion, story, and repetition over long timescales.
Demand generation is marketing that captures intent: reaching people who are already in a purchase decision and making your offer the most obvious choice. It works through relevance, targeting, and conversion mechanics over short timescales.
Think of it this way: brand building is farming, demand generation is harvesting. You cannot harvest a field you never planted. And a field you plant but never harvest produces no revenue. The ratio between the two, how much time and money you spend planting versus harvesting, determines your compounding growth trajectory.
Why It Matters (with Data)
The evidence here is unusually clear for a marketing question.
Les Binet and Peter Field analysed 996 IPA Effectiveness Award case studies spanning 1980 to 2016. Their core finding: campaigns allocating roughly 60% to brand and 40% to activation significantly outperformed all other splits on long-term profit and market share metrics. Every 10 percentage points of Excess Share of Voice translates to +0.5-0.7% annual market share gain in B2C categories, according to research published in the Journal of Advertising by Danenberg, Kennedy, Beal, and Sharp (2016).
The WARC Multiplier Effect report (2024) quantified what happens when brands get this wrong:
- Moving from performance-only to brand-plus-performance: +90% average ROI uplift over three years.
- Moving from brand-plus-performance to performance-only: -40% average ROI decline over the same period.
- Industry average in 2024: 68.8% performance / 31.2% brand, up from 59.9% performance in 2023, a rapid move in the wrong direction.
Brands rated as highly meaningful and different by consumers saw 19% greater brand-value growth in 2024 compared to less differentiated competitors, according to Kantar's BrandZ data. The Best Global Brands collectively left an estimated $200 billion in unrealized revenue on the table in the past 12 months by under-investing in brand equity.
WARC's Voice of the Marketer survey (2025), covering 1,093 practitioners, found that of those expecting budget growth, 51% plan to increase brand investment, a sign the industry is beginning to correct. But intentions and allocations often diverge. The structural bias toward measurable performance spend remains strong.
Sources: WARC Performance Budgets Rise at Expense of Brand | Deep Marketing: 60/40 Rule 2026
How It Works: The 60/40 Playbook
Step 1: Understand What Each Layer Does
| Dimension | Brand Building | Demand Generation |
|---|---|---|
| Timescale | 6 months to 3+ years | Days to weeks |
| Mechanism | Emotional salience, mental availability | Rational persuasion, intent capture |
| Measurement | Brand tracking, share of voice | Conversions, ROAS, CPA |
| Effect decay | Slow (years) | Fast (hours to days) |
| Primary audience | The 95% not currently buying | The 3-5% actively in market |
| Primary metric | Market share growth | Revenue this quarter |
Step 2: Audit Your Current Split
Before changing anything, categorise every line item in your current budget:
- Is this spend reaching people who do not know you yet? That is brand.
- Is this spend converting people who already have some awareness? That is demand.
- Is this spend retargeting or following up known prospects? That is demand.
Most teams discover they are running at 80/20 or even 90/10 in favour of demand once they categorise honestly. The goal is not to jump immediately to 60/40, it is to know where you actually are.
Step 3: Apply the Right Ratio for Your Context
The 60/40 split is a baseline for consumer brands with broad audiences and moderate purchase cycles. It shifts based on your situation:
- B2B and high-consideration purchases: 46% brand / 54% demand (Binet and Field B2B research)
- Fast-moving consumer goods: 65-70% brand / 30-35% demand
- Early-stage startups with no awareness: Weight toward demand initially, build brand as revenue permits
- Mature category leaders: Push brand higher to defend mental availability
Step 4: Choose the Right Channels for Each Layer
Brand channels prioritise reach over precision: TV, out-of-home, podcast sponsorships, display, content marketing, PR, and video. The goal is broad exposure to the full category, not just people currently searching.
Demand channels prioritise intent over reach: paid search, retargeting, email sequences, affiliate, and conversion-optimised social. The goal is capturing people who are already in decision mode.
Step 5: Measure Each Layer with the Right Instruments
Brand and demand need different measurement tools. Using demand metrics to evaluate brand campaigns is the single most common cause of premature brand cuts.
- Media Mix Modelling (MMM): Statistical analysis that attributes revenue contribution to brand versus demand spend over multi-year horizons. Several platforms now offer MMM at mid-market price points.
- Brand tracking studies: Quarterly surveys measuring aided and unaided awareness, consideration, and preference in your target category.
- Excess Share of Voice (ESOV): Compare your share of voice to your share of market. Brands holding SOV above SOM tend to grow. This is one of the most robust predictors in the Binet and Field dataset.
- 2.5x conversion lift: Known brands convert at 2.5 times the rate of unfamiliar brands at the demand stage, which means brand investment shows up indirectly in your demand channel metrics over time.
How the Two Paths Compound
The critical path most teams miss is the feedback loop at the bottom: brand investment reduces customer acquisition cost over time, which makes every demand generation dollar more efficient. Teams that only measure demand efficiency never see this leverage.
Real Company Examples
Nike: The Cost of Abandoning Brand (2024)
Nike spent much of 2021-2023 aggressively cutting brand marketing and shifting investment toward direct-to-consumer performance channels and digital activation. The logic was clean attribution and higher short-term margins. The result was the opposite of the plan.
By 2024, Nike's revenue growth had stalled, market share had eroded to competitors like On Running and Hoka, and the company acknowledged the brand had lost cultural relevance among younger consumers. In their Q1 2025 earnings call, Nike's incoming CEO Elliott Hill specifically cited the need to "rebuild brand investment" and return to sport-led storytelling. Nike's stock had declined roughly 30% from its 2021 peak by mid-2024, a real-world demonstration of what the WARC Multiplier Effect data predicts: cutting brand produces a 40% ROI decline over a multi-year window.
Airbnb: The Successful Rebalance (2021-2024)
Airbnb provides one of the clearest documented cases of a successful brand-to-demand rebalance. During the COVID-19 pandemic, Airbnb cut almost all of its performance marketing spend, paid search, affiliates, display, and redirected toward brand storytelling and PR.
The results contradicted conventional marketing wisdom: direct and organic traffic recovered faster than paid traffic would have predicted, and Airbnb's cost per booking actually decreased in the recovery period. By 2023, Airbnb's marketing spend as a percentage of revenue was significantly below competitor OTAs, yet the company was generating higher margins. CEO Brian Chesky stated in a 2023 investor call that the company had found performance marketing was "masking" the brand's underlying strength. Airbnb's brand index scores improved consistently from 2021 to 2024, and the company's market share held or grew in most core markets, a direct consequence of investing in the 95% of travelers not currently booking.
The Excess Share of Voice rule in practice: if your brand holds 15% market share but only 10% share of voice in your category, you are investing below your maintenance level and will likely lose share over time. If you hold 10% market share but 20% share of voice, you are over-investing relative to your position and should expect to gain share. The ESOV target is not a fixed number, it shifts with your growth ambition.
The B2B adjustment: LinkedIn's B2B Institute research on the 95-5 Rule found that in B2B, only 5% of buyers are in-market at any given time, even more extreme than the 3-5% consumer figure. This makes brand investment proportionally more important in B2B, not less, despite the common assumption that B2B is a pure rational-decision category. Binet and Field's own B2B follow-up research recommends 46% brand / 54% demand as the B2B optimum, compared to 60/40 for consumer brands.
Common Mistakes
1. Measuring Brand Campaigns with Demand Metrics
Evaluating a brand campaign on 30-day ROAS or CPA is like judging a marathon runner by their 100-meter split time. Brand campaigns are designed to shift awareness and preference over months and years. Applying short-window attribution to them produces a false negative that triggers budget cuts, and then the long-term damage compounds silently.
2. Cutting Brand During Downturns
When budgets tighten, brand spend is almost always the first to go because its ROI is hardest to attribute in a quarterly reporting cycle. This is the most expensive mistake in the Binet and Field dataset. Brands that maintained brand investment through the 2008-2009 recession recovered market share 3 times faster than those that went performance-only. The brands that cut brand in a downturn paid for the savings multiple times over in the recovery period.
3. Treating 60/40 as a Fixed Rule Rather Than a Baseline
The 60/40 split is a starting point derived from averaging across many categories and company sizes. Applying it rigidly without adjusting for your category maturity, purchase cycle, and current awareness levels is just replacing one blunt instrument with another. The research gives you a direction to calibrate from, not a universal constant.
4. Confusing Content Marketing with Brand Building
Content marketing, SEO, and thought leadership are powerful tactics, but they primarily serve bottom-of-funnel and mid-funnel users who are already engaged with your category. They are not substitutes for broad-reach brand investment. Many B2B companies count their blog and SEO spend as "brand" and conclude they are already investing enough. They are not measuring the right thing.
5. Waiting Until Brand Is Broken to Fix It
Brand equity degrades slowly and invisibly. By the time declining brand scores show up as higher CPA or lower conversion rates in your performance channels, you have already lost 12 to 24 months of compounding. The time to invest in brand is before you need it, not after the metrics break.
Key Takeaways
- The 2024 industry average is 68.8% performance / 31.2% brand, the inverse of the evidence-recommended split, and a worse ratio than 2023.
- Rebalancing toward 60/40 brand/demand is associated with a 90% average ROI uplift over three years; going the other way produces a 40% decline (WARC, 2024).
- Demand generation only reaches 3-5% of your market at any moment; brand building shapes the other 95% who will eventually buy.
- Known brands convert at 2.5 times the rate of unfamiliar brands at the demand stage, brand investment shows up in your performance metrics, just with a lag.
- The B2B optimum is 46% brand / 54% demand, not the consumer-brand 60/40, because only 5% of B2B buyers are in-market at any given time.
- Fix measurement first: Media Mix Modelling and quarterly brand tracking are the tools that make brand investment defensible inside organisations that default to short-termism.