RFM Segmentation
What It Is
RFM segmentation is a behavioral analytics framework that scores every customer on three dimensions: how recently they purchased, how frequently they buy, and how much monetary value they have delivered. First formalized in 1995 for direct-mail marketing, it has become one of the most durable customer-scoring systems in commercial use because it requires no survey data, no demographics, and no guesswork. Every score is derived entirely from transaction records you already hold.
The core insight behind RFM is that past purchasing behavior predicts future purchasing behavior better than who a customer is. A 55-year-old who bought from you three days ago and has placed ten orders this year is a better email target than a 25-year-old who bought once eighteen months ago, regardless of what demographic persona either person fits. RFM makes that priority order explicit and computable.
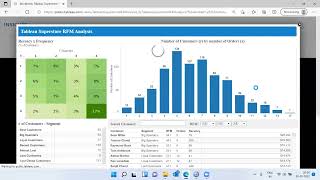
Each customer receives a score of 1 to 5 on each axis, where 5 is best. Recency 5 means the customer bought very recently; Frequency 5 means they buy very often; Monetary 5 means they are among your top spenders. Scoring is percentile-based: the top 20 percent of customers on a given axis get a 5, the next 20 percent get a 4, and so on. The three scores combine into a profile such as "5-5-5" (Champion) or "1-1-1" (Lapsed). With a 5-point scale this produces 125 possible combinations, though in practice marketers collapse these into 8 to 12 actionable segments.
Real-World Example
PersonaClick documented a fashion retailer that applied RFM to its email list and saw win-back open rates climb from 12 percent to 28 percent while simultaneously reducing total send volume by 40 percent. The mechanism: Hibernating customers (R1, F1-2) were suppressed from the daily blast, which let sender reputation recover and caused the engaged segments to perform better in the inbox. This pattern is now a standard playbook built into Klaviyo's "Predicted CLV" module and Bloomreach's "Customer Lifecycle" feature. The underlying math is consistent with broader segmentation data: Campaign Monitor found segmented campaigns drive up to 760 percent more revenue than one-to-all sends, and DMA research shows segmented sends generate 30 percent more opens and 50 percent more click-throughs.
Why It Matters
- Budget efficiency: RFM lets you concentrate spend where it has the highest probability of return. Champions (high on all three axes) are already converted; they need recognition, not heavy discounts. Lapsed customers need a compelling reason to return. Treating both groups identically wastes money on one and leaves revenue on the table with the other.
- Precision re-engagement: Companies using RFM-driven email flows report 10 to 30 percent increases in customer retention rates (CleverTap, 2024), because win-back campaigns reach people at a calibrated behavioral moment rather than blindly.
- Revenue concentration insight: In most ecommerce datasets, the top RFM quintile generates 50 to 70 percent of total revenue while representing 20 percent or less of the list. Knowing this lets you protect that segment aggressively rather than burning them with promotion fatigue.
- Platform agnostic: RFM works in Klaviyo, Braze, HubSpot, Salesforce Marketing Cloud, or a simple spreadsheet. It only requires a table of customer IDs, purchase dates, order counts, and order values.
- Adaptable beyond ecommerce: SaaS products substitute login frequency for purchase frequency and feature adoption depth for monetary value. Media platforms use content consumption frequency. Subscription businesses replace recency with days since last renewal.
How It Works
Step 1: Pull your data
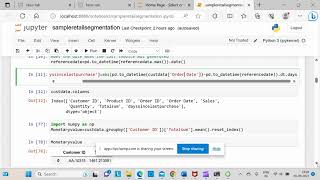
Export a transaction table with at minimum: customer_id, order_date, order_value. Calculate three derived fields per customer from a rolling 12-to-24-month window:
- Days since last order (Recency)
- Total number of orders (Frequency)
- Total spend (Monetary)
Cap at 24 months maximum. A customer who spent $5,000 in 2019 and nothing since is not a VIP today.
Step 2: Score each dimension on quintiles
Sort customers by each metric independently and assign ranks 1 to 5. For Recency, fewer days since order equals a higher score. For Frequency and Monetary, higher values equal a higher score. Recompute quintile boundaries monthly; they drift as your customer base grows.
Step 3: Map scores to named segments
New West KnifeWorks' Klaviyo-managed customer database, segmented into 6 RFM groups including a dedicated 'Inactive' segment of customers who had not purchased in a long time, some for 3+ years The team wanted to know whether infrequent, long-lapsed customers were worth continuing to email, or whether that send volume was better spent elsewhere On a National Knife Day sale campaign, the team sent to all 6 RFM segments including the Inactive group instead of excluding it, then tracked revenue by segment
Result: The Inactive segment generated 15% of total campaign revenue on that sale, and the approach contributed to 31% year-over-year growth in converted customers and 21% year-over-year growth in Klaviyo-attributed revenue over the following 6 months (6-month period following the National Knife Day campaign).
Source| Segment | Typical RFM Profile | Email Strategy |
|---|---|---|
| Champions | R4-5, F4-5, M4-5 | Reward, request reviews, referral program |
| Loyal Customers | R3-5, F4-5 | VIP perks, early access, upsell |
| Potential Loyalists | R4-5, F2-3 | Nurture with cross-sells, third-order nudge |
| New Customers | R5, F1 | Welcome flow, brand story, social proof |
| At Risk | R1-2, F3-5, M3-5 | Win-back with a meaningful offer |
| Can't Lose Them | R1, F4-5, M4-5 | Aggressive win-back; call if high monetary |
| About to Sleep | R2-3, F1-2 | Light reactivation; content not discount |
| Lapsed | R1, F1-2, M1-2 | Last-chance email or suppress from list |
Step 4: Wire into segment-specific flows
Ruffwear's Klaviyo account, where customers entering the 'Needs attention' and 'At risk' RFM segments automatically triggered a dedicated retention flow personalized with purchase-history product recommendations Ruffwear was applying the same blanket discount to re-engage every lapsed customer, which protected no margin and did not account for what each customer had already bought The team built automated flows keyed to RFM segment entry, matching offer depth and messaging to each segment instead of sending the same coupon to everyone, per digital marketing manager Ernie Kucera
Result: Campaign click rate rose 49% within 90 days, RFM-triggered retention flows generated $6.5K in incremental revenue in their first month, and the team cut its year-over-year discount rate by 10% while revenue grew 9% over the same 6 months (First 90 days after launch, with the discount-rate figure measured over the following 6 months).
SourceEach segment gets a different cadence, tone, and offer. Champions receive early access and exclusives, not 20-percent-off coupons. At-Risk customers receive a direct "we miss you" email referencing their favorite category with a meaningful, escalating offer sequence. Lapsed customers get a final re-permission email before removal from the active list.
Step 5: Refresh scores monthly
RFM scores decay. A customer who was a Champion in January may be At-Risk by March. Most teams refresh scores monthly; high-volume retailers refresh weekly. Automate the scoring in your ESP or data warehouse so segments update without manual re-exports.
Common Mistakes
Mistake 1: Creating too many segments. The 5-point scale produces 125 possible RFM combinations. Marketers who try to design unique campaigns for all of them end up with decision paralysis and inconsistent execution. Best practice is 8 to 12 named segments with a clear playbook for each. Collapse the 125 cells into a manageable grid using lookup tables or conditional logic in your ESP.
Mistake 2: Weighting all three metrics equally. Recency is the strongest predictor of future purchase in most datasets. A common industry weighting is Recency 50 percent, Frequency 30 percent, Monetary 20 percent. Averaging R+F+M as equals lets a customer who spent heavily three years ago outscore someone who bought last week, which inverts the real purchase-likelihood signal and sends budget away from your warmest leads.
Use your Monetary score to set discount depth, not campaign eligibility. A high-monetary Champion should never need a 30-percent coupon to re-engage; a mid-tier At-Risk customer might. By decoupling "who gets an email" (Recency plus Frequency) from "what offer they receive" (Monetary), you protect margin on your best customers while still converting borderline ones.
The One-Line Takeaway
RFM replaces 'who is this person' with 'what has this person done lately', and that behavioral signal is the most reliable input you have for deciding who to email, when, and with what offer.