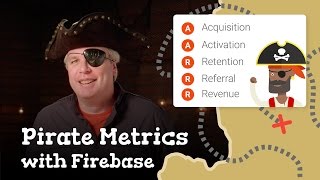
AARRR: Pirate Metrics
In 2025, the average B2B SaaS product activates fewer than 4 in 10 new signups. The other 6 never experience the product's core value, then disappear forever. AARRR is the framework that makes that leak visible and tells you exactly where to plug it.
Quick Summary
- AARRR (Acquisition, Activation, Retention, Referral, Revenue) maps the full user journey into five measurable stages.
- The median activation rate across B2B SaaS is just 37%, meaning most of your ad spend evaporates before users see any value. Source: Userpilot 2024
- Fixing one mid-funnel stage (like Activation) compounds benefits to every stage below it at zero extra acquisition cost.
- The correct order to fix stages is: Retention first, then Activation, then Referral, then Revenue, then Acquisition last.
- 90% of startups fail within five years, and a broken customer lifecycle is the most common root cause. Source: Purchasely 2025
What It Actually Is
AARRR is a five-stage growth framework created by Dave McClure (founder of 500 Startups) in 2007 to give startups a single, measurable map of the user lifecycle. Each letter stands for one stage: Acquisition, Activation, Retention, Referral, Revenue.
Think of it as a series of doors. Every new user starts outside and must walk through each door in sequence. Your job is to measure how many people pass through each door and why others stop. Most products have one door that is dramatically harder to open than the others. That door is your growth bottleneck, and fixing it is worth more than any new marketing campaign.
Why it is called 'Pirate Metrics': Say all five letters out loud: AARRR. It sounds like a pirate's growl. The name stuck because it is memorable, and because Dave McClure wanted a framework that felt actionable rather than academic. It worked.
Why It Matters (with Data)
The data on broken funnels is stark:
- The average user activation rate across 62 B2B companies is 37.5%, and the median is 37%. In sectors like FinTech and HR, it collapses to 5-8%. Userpilot, 2024
- Amplitude's 2025 benchmark data (from 2,600+ companies) found that over 98% of users who never hit a value milestone churn within two weeks.
- B2B SaaS companies report an average annual retention rate of 74%, with top performers achieving net revenue retention above 120%. SaaS Metrics Benchmarks 2025
- CB Insights' 2024 analysis of 431 failed VC-backed startups found that 43% failed due to poor product-market fit, which almost always shows up first as low Activation and Retention, not low Acquisition.
- Teams that fix Activation before scaling Acquisition see compounding benefits: doubling activation rate from 20% to 40% effectively doubles the throughput of every downstream stage without spending a single extra dollar on ads.
The pattern is consistent: most teams invest heavily in Acquisition (ads, SEO, PR) while Activation and Retention quietly drain their returns. AARRR makes that misallocation visible.
How It Works: The Five Stages
Stage 1: Acquisition, How Do People Find You?
Acquisition covers every channel that delivers a new user to your product for the first time: SEO, paid ads, social media, press, word of mouth, influencer partnerships, or a direct referral.
The key metric is not total visitors. It is cost per acquisition (CPA) by channel. A blog post bringing 500 visitors for $200 of writing time costs $0.40 per visitor. A paid campaign bringing the same 500 for $2,000 costs $4.00. AARRR forces you to compare those numbers honestly and allocate budget to the channels that deliver users who actually activate and retain.
What to track: visitors by channel, CPA by channel, visitor-to-signup conversion rate.
Stage 2: Activation, Did They Experience the Value?
Activation is the moment a new user first feels the core value of your product. It is not signing up. It is completing the specific action that makes the product worth using.
Every product has a distinct activation event. You have to find yours through data:
- Facebook (early days): adding 7 friends within the first 10 days dramatically increased long-term retention.
- Slack: a team that sent 2,000 messages considered itself genuinely activated.
- Duolingo: completing the first lesson and setting a daily streak goal is the activation milestone.
With an industry median of 37%, Activation is almost always the highest-leverage stage to improve. Doubling your activation rate doubles the output of every stage below it with no additional acquisition spend.
What to track: percentage of signups who complete the activation event within 24 hours, 3 days, and 7 days.
Stage 3: Retention, Do They Come Back?
Headspace's lifecycle marketing team, running behavior-triggered push and in-app campaigns via Braze New users who installed but never built a meditation habit were churning inside their first week, and generic time-based reminders weren't reversing it Personalized push notifications and deep-linked in-app messages tied to each user's meditation history and content preferences, sent to new (0-1 activation phase) and dormant users, rather than a single generic reminder
Result: Users who received the campaigns showed 109% higher retention in Week 1 versus a control group, plus a 26% uplift in new-user activation (Measured across a multi-quarter lifecycle marketing engagement).
SourceRetention measures whether users return after their first session. It is tracked as Day 1, Day 7, and Day 30 retention. Low Day 30 retention is the clearest early signal of a product-market fit problem.
Apple Fitness+ engineers retention by running recurring programs: "Time to Walk" audio experiences and "Artist Spotlight" workout series create weekly touchpoints that keep users coming back. The goal is habit formation. Once a user has a habit, churn drops sharply.
For subscription products, track churn rate monthly. B2B SaaS benchmarks show average annual retention at 74%, but top performers maintain well above 85% by investing in onboarding and in-app guidance before users drift away.
What to track: Day 1, Day 7, Day 30 retention rates; monthly churn rate; average sessions per week.
Stage 4: Referral, Do They Bring Others?
Airbnb's growth team, redesigning their existing but under-used referral program A first referral program launched in 2011 sat almost unused for three years, hurt by poor UX, no mobile support, and manual sharing A full redesign, Referrals 2.0, with mobile-first frictionless sharing (WhatsApp, Messenger), personalized invites, a double-sided reward ($25 for the guest, $75 for the host), and fraud controls
Result: Daily bookings and signups increased 300%, and first-time bookings grew 900% year-on-year (Following the Referrals 2.0 relaunch).
SourceReferral measures whether existing users bring in new users. A viral coefficient (K-factor) above 1.0 means each user brings in more than one new user, creating self-sustaining growth without ongoing ad spend.
Referral is the most underused and under-engineered stage. Word-of-mouth rarely happens organically at scale. The best referral loops are built deliberately with three components:
- Trigger: when do you ask? (after activation, after a positive outcome, after a milestone)
- Mechanic: what do users share? (a link, an invite, a creation from inside the product)
- Incentive: why do they share? (two-sided reward, social currency, status)
What to track: referral rate (new users from referrals divided by total new users), K-factor, Net Promoter Score (NPS) as a leading indicator.
Stage 5: Revenue, Do They Pay?
Revenue measures how you convert user activity into business income. For SaaS: Monthly Recurring Revenue (MRR), free-to-paid conversion rate, and Average Revenue Per User (ARPU). For e-commerce: average order value and purchase frequency.
Revenue must always be evaluated against acquisition cost. If your Customer Acquisition Cost (CAC) is $100 and your Lifetime Value (LTV) is $80, you lose money on every customer. The healthy target is an LTV-to-CAC ratio of 3:1 or higher.
Strava locks advanced analytics and route planning behind a paid tier. The free tier drives Activation and Retention. The paid tier captures Revenue from power users who are already deeply engaged. That sequencing, free value first, paid upgrade second, is the correct order.
What to track: MRR/ARR, free-to-paid conversion rate, ARPU, LTV, LTV-to-CAC ratio (target: 3:1 or above).
Where to Start: Diagnosing Your Funnel
Most teams optimize the wrong stage for months. Use this decision tree to find your real bottleneck:
Run this diagnostic every month. Your bottleneck shifts as the product matures, and a fix in one stage often reveals a new constraint in another.
Real Company Examples
Dropbox: Engineering Every Stage Deliberately (2008-2009)
Dropbox grew from 100,000 users to nearly 4 million in 15 months, a 3,900% increase, by systematically optimizing each AARRR stage:
- Acquisition: A pre-launch waitlist referral program built buzz before the product was publicly available.
- Activation: A 2-minute demo video explaining how file sync worked increased signups by 10% overnight.
- Retention: Seamless cross-device sync made Dropbox indispensable to daily work.
- Referral: Both the referrer and new user received 500MB of free storage. This two-sided incentive drove 35% of all daily signups at its peak.
- Revenue: Freemium converted heavy users to paid plans when they hit storage limits.
The referral program is now a textbook example of engineered virality precisely because it cost Dropbox almost nothing (storage was cheap) while providing high perceived value to both sides.
Duolingo: Activation as a Personalization Problem (2023-2025)
Duolingo reached 500 million registered users by 2023 and has maintained daily active user rates well above the app industry average. Their activation strategy is deliberately personalized: new users are asked about existing language knowledge and learning goals before the first lesson begins.
Beginners get quick wins through simple vocabulary. Advanced learners jump into grammar and conversation. The result is that the first session feels tailored, not generic, which drives completion and Day 1 retention. Duolingo then uses streak mechanics to lock in Retention: breaking a streak triggers loss-aversion psychology, one of the most effective habit-formation tools in consumer apps.
The lesson: Activation is not a single event. It is a sequence of small wins that lead to a habit. Design for the sequence, not just the signup.
Common Mistakes
Scaling Acquisition before fixing Retention. If Day 7 retention is below 15%, you are filling a leaky bucket. Every dollar you spend on ads accelerates the rate at which users churn out. CB Insights found 43% of failed VC-backed startups cited poor product-market fit, which almost always manifests first as broken Retention, not low Acquisition.
Treating Referral as a 'nice to have.' Most teams assume good products generate word-of-mouth automatically. They rarely do at scale. Referral requires a deliberate trigger, mechanic, and incentive. Without engineering it, you leave your highest-trust and lowest-cost acquisition channel completely untapped.
Using a vanity activation metric. Defining activation as 'signed up' or 'completed onboarding' instead of 'experienced the core value' leads to misleadingly high activation numbers that do not predict retention. Slack's 2,000-message threshold and Facebook's 7-friends benchmark both measure real engagement, not just presence.
Ignoring LTV-to-CAC at Revenue stage. Teams celebrate MRR growth without checking whether each new customer is profitable. If LTV is below 3x CAC, scaling acquisition makes the unit economics worse, not better. Fix pricing, packaging, or retention first.
Instrument before you optimize. Many teams discover, mid-experiment, that they cannot actually measure Activation or Retention because the event tracking was never set up. Your first sprint should be analytics infrastructure: funnel tracking, cohort analysis, and event logging. Every optimization after that produces real signal instead of noise.
Key Takeaways
- The industry median activation rate is 37%. If yours is lower, fixing Activation is worth more than any new ad campaign.
- 98% of users who never hit a value milestone churn within two weeks. Your onboarding sequence is a retention investment, not just a UX detail.
- Fix stages in this order: Retention, then Activation, then Referral, then Revenue, then Acquisition. Working the funnel in reverse prevents you from scaling a leaky bucket.
- Every great referral loop has three parts: a trigger, a mechanic, and an incentive. None of the three happens by accident.
- LTV-to-CAC should be 3:1 or higher. Below that ratio, growth is shrinking your business, not building it.
- Measure each stage monthly. The bottleneck shifts as the product matures, and last quarter's fix reveals this quarter's constraint.