The North Star Metric
In 2025, the teams winning on growth are not tracking more metrics, they are tracking the right one. The North Star Metric (NSM) is a single number that captures the core value your product delivers to real customers, and research shows companies that define it see a 60% higher rate of product-market fit retention compared to those tracking generic revenue KPIs (Mixpanel, 2024).
Quick Summary
- A North Star Metric is ONE number that measures the value customers get from your product, not revenue, not signups.
- It must be a leading indicator: it predicts future revenue rather than just reporting past results.
- Every team in the company should be able to influence it with their daily work.
- Break it into 3-5 input metrics so individual teams have something concrete to act on each sprint.
- Revisit your NSM at least once a year, the right metric for your current stage often changes as you scale.
What It Actually Is
The North Star Metric is the one metric that best predicts long-term, sustainable growth. It sits between vanity metrics (too early, too shallow) and revenue (too late, too downstream). Think of it as the proof that a customer received real value, not that they clicked a button.
The analogy that makes it click: a restaurant's NSM is not "tables booked" (vanity) or "monthly revenue" (lagging). It is "meals enjoyed", the moment value is actually delivered. Revenue follows when people enjoy meals repeatedly and tell friends. Signups are irrelevant if no one eats.
Here is how the spectrum works:
- Too downstream (lagging): Quarterly revenue, annual ARR (Annual Recurring Revenue), net profit
- Too upstream (vanity): App downloads, registered users, email signups, pageviews
- Just right (the NSM): The moment a customer gets the core value your product promises
Spotify's NSM is streaming hours listened, not paid subscribers. Users who listen more churn less and upgrade more. Move listening time up and revenue follows automatically.
The North Star Metric concept was popularized by Sean Ellis around 2010 and codified into a full operating framework by Amplitude's North Star Playbook, first published in 2017. Amplitude's framework, built from studying hundreds of product teams, defines three requirements an effective NSM must satisfy simultaneously: it must express customer value, act as a leading indicator of revenue, and be actionable by multiple teams. Lagging metrics like quarterly revenue fail the third test, by the time the number moves, the work that caused it is months old.
Why It Matters (With Data)
The case for using an NSM is not theoretical, it is backed by measurable outcomes:
- Companies tracking a defined NSM see 60% higher product-market fit retention compared to those tracking generic revenue KPIs (Mixpanel, 2024).
- Increasing customer retention by just 5% through value-based tracking can increase profits by 25% to 95% (Bain and Company).
- In 2025, leading SaaS firms are embedding usage and lifecycle metrics into their operating rhythms, with top performers achieving Net Revenue Retention (NRR) above 120%, growing at twice the rate of peers who fall below that threshold (2025 Software Study via Simon-Kucher).
- The shift in 2025 is clear: companies are moving from acquisition-first metrics toward retention and value-delivery metrics as their primary growth focus.
The core logic is simple. When you optimize for the moment value is delivered, retention improves. When retention improves, revenue compounds. Revenue-first thinking skips the cause and optimizes for the effect.
The Three Games Your Product Can Play
Every product fits one of three engagement models. Knowing which game you play points you directly toward the right NSM type.
| Game | What It Measures | Examples |
|---|---|---|
| Attention Game | Time spent in product | Spotify, Netflix, TikTok, YouTube |
| Transaction Game | Frequency of completed transactions | Airbnb, Uber, Amazon, Stripe |
| Productivity Game | Work output or efficiency created | Slack, Notion, Figma, Salesforce |
Pick the game that matches how your product creates value. A productivity tool measuring "time spent" is measuring the wrong thing entirely, you want users to complete work fast, not linger.
How the NSM Fits into Your Metrics Stack
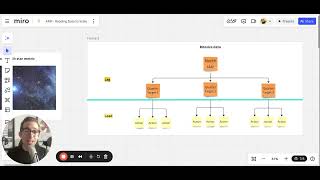
The NSM sits at the center of your metrics stack. Above it is the company's ultimate goal, revenue or profit. Below it are the input metrics that individual teams own and move every week. The feedback loop is the point: team actions move inputs, inputs move the NSM, and the NSM predicts revenue.
The Four-Step Playbook to Find Your NSM
Step 1, Write the Value Statement
Finish this sentence: "Our product is valuable when a customer ______."
- Airbnb: "...books and stays in a place."
- Slack: "...sends messages inside a team."
- Dropbox: "...stores and retrieves files from any device."
- Duolingo: "...completes a language lesson daily."
- Netflix: "...watches content that satisfies them."
The verb in your answer usually points directly to your NSM.
Step 2, Turn the Verb into a Metric
Take the action from your value statement and make it measurable and countable:
- "books and stays" becomes "nights booked"
- "sends messages" becomes "messages sent per team"
- "completes a lesson daily" becomes "daily active learners"
- "watches content" becomes "median hours watched per subscriber per month"
Step 3, Test Against Three Criteria
Ask these three questions. If any answer is "no," go back to step 2 and iterate:
- Does it reflect real customer value (not just activity or account creation)?
- Does it predict revenue (is it a leading indicator, not a lagging one)?
- Can multiple teams in the company move it with their day-to-day work?
Step 4, Decompose into Input Metrics
An NSM that only the CEO can influence is useless. Break it into 3-5 input metrics that individual teams own. Amplitude's framework names four categories of inputs:
- Breadth: How many users reach the core value moment? (new user activation rate, first-week completion rate)
- Depth: How deeply are they using the product? (features adopted per user, integrations connected)
- Frequency: How often do they return? (sessions per week, monthly active rate)
- Efficiency: How fast do they reach value? (time-to-first-value in minutes, onboarding completion rate)
Worked Example: A SaaS Project Management Tool
Step 1, Value statement: "Our product is valuable when a team completes a project on time using our tool."
Step 2, Metric: "Number of projects marked complete per team per month."
Step 3, Three-criteria test:
- Does it reflect customer value? Yes, completing projects is the core job to be done.
- Does it lead revenue? Yes, teams completing projects stay subscribed and expand seats.
- Can multiple teams move it? Yes, product, onboarding, and customer success all have levers.
Step 4, Input decomposition:
- Breadth: new team activation rate (teams that start their first project within 7 days)
- Depth: tasks assigned per project (signal of genuine team adoption)
- Frequency: projects started per team per month
- Efficiency: time from team creation to first project launched
That is your NSM stack. Individual teams own the inputs. Leadership watches the NSM.
Real Company Examples
Airbnb, "Nights Booked" (2012 to Present)
Airbnb moved from tracking signups to nights booked as its core operating metric. In its S-1 IPO filing for its 2020 stock market listing, "Nights and Experiences Booked" was the headline operating metric, totaling 251 million in 2019. The shift mattered because signups told Airbnb almost nothing about whether hosts and guests were actually getting value. Nights booked measured value delivered on both sides of the marketplace simultaneously. A night booked means a guest found a place they wanted, and a host earned money, both sides won.
Slack, "Teams That Have Sent 2,000+ Messages"
Slack's internal growth team identified that teams reaching 2,000 messages sent had an extremely high probability of converting to paid plans and staying long-term. This specific threshold became their proxy for "a team that has genuinely adopted the product." It is a precise NSM because it measures actual value delivered (teams communicating effectively at scale), not just account creation or logins. The number 2,000 was not guessed, it was discovered through cohort analysis comparing conversion rates across message-count segments.
Netflix, "Median View Hours Per Subscriber Per Month"
Netflix reports subscriber count publicly, but internally the team tracks engagement depth. Their shareholder communications from 2023 and 2024 consistently emphasize that members who engage consistently have dramatically lower churn rates. The internal metric ensures Netflix optimizes for genuine viewing satisfaction, not just subscriber acquisition. This distinction drove their shift to investing in must-watch originals over volume content.
Facebook, "Users Who Add 7 Friends in 10 Days"
Facebook's early growth team, led by Chamath Palihapitiya, discovered through data analysis that users who added at least 7 friends within their first 10 days had dramatically higher long-term retention. Their public NSM was Monthly Active Users (MAU), but internally the 7-friends-in-10-days activation event was what the growth team optimized for. This finding reshaped Facebook's entire onboarding experience and is widely credited with driving explosive growth from 2008 to 2012.
Anghami, Streaming Sessions per Active User (2024)
Anghami, a legal music streaming platform serving over 70 million users across the Middle East and North Africa, aligned their product and marketing teams behind a single NSM to create clarity across their distributed organization. As documented in Amplitude's 2025 case studies, the shift to a shared metric reduced internal conflict over priorities and improved their ability to run coordinated growth experiments across product and marketing.
NSM Patterns by Business Model
| Business Type | Common NSM | Companies |
|---|---|---|
| Marketplace | Completed transactions | Airbnb (nights booked), Uber (rides completed) |
| Social and Content | Time spent or sessions | Facebook (DAU), Netflix (view hours), Spotify (listening time) |
| SaaS and Collaboration | Active teams doing the core action | Slack (teams at 2k messages), Asana (tasks completed) |
| Storage and Utility | Files or actions completed | Dropbox (files saved), Google Drive (docs created) |
| E-commerce | Gross Merchandise Volume | Amazon (orders shipped), Shopify (merchant revenue processed) |
| Freemium B2B | Weekly paid active seats | Airtable (weekly paid users), Notion (paid workspaces active) |
Common Mistakes
Five mistakes that kill NSM programs:
-
Picking revenue as your NSM. Revenue is a lagging result, not a leading indicator. You can boost it short-term with discounts while destroying long-term retention at the same time. By the time revenue drops, the damage to the product experience is already months old.
-
Picking a vanity metric. Signups, pageviews, app downloads, and raw Monthly Active Users (MAU) often rise while the actual product experience worsens. If your NSM climbs but churn also climbs, your NSM is wrong, it is measuring noise, not value.
-
Never revisiting it. Your NSM is not permanent. LinkedIn's early metrics around endorsements made sense in the connection-building era but would be a poor fit today. Reassess your NSM whenever you change your core product motion, move upmarket, or shift your primary acquisition channel.
-
Letting every team have its own NSM. The whole point is alignment. If marketing tracks one number and product tracks another, you do not have a North Star, you have two compasses pointing different directions. One metric. One company.
-
Skipping the input layer. An NSM without input metrics is a dashboard metric, not an operating metric. If the only person who can move the number is the CEO, the framework is decoration. Decompose it or it will not drive behavior.
Before Product-Market Fit: A Special Case
If your product is early-stage and you are not sure yet whether people genuinely want it, do not obsess over an NSM. Instead, track cohort retention, what percentage of users who signed up in month X are still active in month X plus 3. Retention is the clearest signal of product-market fit available. Once your retention curves flatten at a healthy level, you have confirmed that customers value the product and you are ready to pick an NSM.
Trying to optimize an NSM before product-market fit is like tuning the engine of a car that has no steering wheel. Fix the steering first.
Before vs. After NSM: A Real Comparison
A B2B SaaS onboarding team tracked "users who completed account setup" as their success metric. Setup completion was high. Churn at month 3 was also high. The metric looked healthy but the business was bleeding.
After switching to "teams that complete their first workflow within 14 days," setup completion became irrelevant. The team discovered that 40% of users who completed setup never ran a single workflow, they were being counted as activated without ever experiencing value.
Reorienting around the value moment cut 3-month churn by 28% within two quarters. The metric changed before the product changed, it pointed the team at the right problem.
Key Takeaways
- Your NSM is not what you build, it is the value customers get when they use what you built.
- Revenue is an outcome. Your NSM is the cause. Optimize the cause.
- If your NSM goes up but churn also goes up, you have the wrong NSM.
- The input metrics are where teams do their real work, the NSM is just the scoreboard.
- One company, one North Star. Fragmented metrics produce fragmented teams.
- The right NSM for an early-stage product is often wrong for a scaled product, schedule a review at least once a year.