MMM vs. MTA
What It Is
Imagine you ran five different ads last month: a TV spot, a Google search campaign, some Instagram Stories, a podcast sponsorship, and a few YouTube pre-rolls. Sales went up 20%. Now your boss asks: which of those drove the growth? The answer depends entirely on which measurement method you use. The two most powerful methods give you very different answers.
Quick Summary
- MMM (Marketing Mix Modeling) looks at months or years of aggregated data to estimate how much each channel contributed to revenue
- MTA (Multi-Touch Attribution) tracks individual users across digital touchpoints and assigns credit to each interaction
- MMM is slow, strategic, and privacy-safe; MTA is fast, granular, but breaks without cookies or device IDs
- iOS 14 and cookie deprecation have made MTA less reliable since 2021, giving MMM a major comeback
- The smartest teams use both: MMM for budget decisions, MTA for in-campaign optimization
MMM adoption has nearly tripled since 2023, now used by roughly a quarter of marketing teams, while 27.6% of US marketers rate MMM as their most reliable measurement methodology, ahead of MTA at 19.4%. Enterprise adoption of integrated MTA+MMM frameworks has more than doubled since 2024, and most teams now run both in parallel: MTA for tactical decisions, MMM for strategic budget calls.
Why It Matters
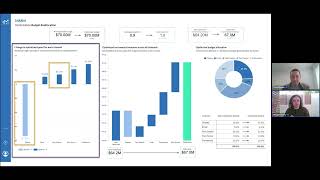
Belgian supermarket chain's marketing team, working with measurement consultancy Gain Theory Delhaize's leadership wanted proof, based on facts rather than instinct, that marketing spend across categories and channels was actually driving sales before committing next year's budget Gain Theory built marketing mix models covering product categories, online and in-store visits, and new customer acquisition, then used scenario planning to show what would happen to sales under different spend allocations
Result: 60% increase in marketing ROI, which justified an increased media budget the following year (2022 analysis informing the 2023 budget cycle).
SourceEvery time you run ads across more than one channel, you face an attribution problem. Which ad got the credit? Which channel actually moved revenue? The model you use to answer that question will shape every budget decision you make.
Get this wrong and you will systematically defund the channels that are quietly doing the most work. Get it right and you can reallocate spend intelligently. Research shows that organizations that reallocate spend using MMM achieve 15-20% higher marketing ROI without increasing their total budget.
This matters even more now because:
- Apple's iOS 14 update (2021) broke the user-level tracking that MTA depends on
- Third-party cookies are being phased out across browsers
- Privacy laws like GDPR and CCPA restrict how user data can be collected and used
All three of these trends hurt MTA and pushed marketers toward MMM.
How Each Model Works
Marketing Mix Modeling (MMM)
MMM feeds a statistical regression model with months or years of weekly data: spend by channel, total sales or revenue, seasonality, holidays, economic conditions, and even competitor activity. The model estimates the marginal contribution of each input. In plain English: how much did an extra dollar of paid social spend actually move the needle, after controlling for everything else?
Because MMM uses aggregated, business-level data rather than individual user data, it sidesteps privacy restrictions entirely. The trade-off is that it requires substantial historical data (typically 2+ years), takes weeks to build and validate, and does not update fast enough to inform day-to-day bidding.
What MMM can measure that MTA cannot:
- TV, radio, and out-of-home advertising
- Organic word of mouth and PR
- Seasonality and economic conditions
- Long-term brand-building effects (called "adstock")
Multi-Touch Attribution (MTA)
MTA stitches together a user's journey across digital touchpoints. Example: a Google search ad click on Monday, a retargeting display impression on Wednesday, a direct visit and purchase on Friday. It then distributes credit across those interactions.
Different MTA models assign credit differently:
- Last-click: 100% credit to the final touchpoint before conversion
- First-click: 100% credit to the first touchpoint
- Linear: credit split evenly across all touchpoints
- Time-decay: more credit to touchpoints closer to conversion
- Data-driven: machine learning weights touchpoints by observed contribution
MTA is fast, granular, and actionable for in-platform optimization. But it only sees what it can track. This means it systematically undercounts TV, podcasts, organic social, and any touch where the user cannot be identified (which is increasingly common after iOS 14).
Real-World Examples
In 2022, Airbnb ran a large-scale brand awareness campaign across TV, digital display, and paid social. Their MTA data showed display ads as a weak performer, users who saw display ads rarely clicked, and last-click attribution gave display almost no credit. But when Airbnb's data science team ran an MMM analysis over 18 months of data, display accounted for roughly 15% of incremental bookings by building brand recognition that lifted conversion rates on search ads by approximately 12%. Cutting display based on MTA alone would have cost them millions in downstream bookings.
Google MMM case study (2024): Japanese video game company Nexon used MMM to analyze all their media channels. The analysis revealed that Google Display Network delivered the highest ROI of any channel they used, and that YouTube played a key role in indirectly lifting performance across other channels. Before running the MMM, both channels were undervalued in their standard reporting.
YouTube ROAS finding (Nielsen meta-analysis): On average, YouTube ROAS grew by 108% for brands that collaborated with Google on MMM calibration. That is a 7x greater increase compared to brands that did not use MMM to measure YouTube's contribution.
MMM budget reallocation results: A case study from Cassandra App (2024) showed that one brand achieved +13% more conversions with the exact same total ad budget, simply by reallocating spend based on MMM findings. No extra money was spent, just smarter distribution.
Side-by-Side Comparison
| Factor | MMM | MTA |
|---|---|---|
| Data granularity | Aggregated (channel-level) | User-level (touchpoint-level) |
| Speed | Weeks to months to build | Near real-time |
| Privacy safe | Yes | No (requires cookies or IDs) |
| Covers offline media | Yes (TV, radio, OOH) | Rarely |
| Best for | Budget allocation | Campaign optimization |
| Minimum data needed | 2+ years | Ongoing user events |
| Affected by iOS 14 | No | Yes, significantly |
| Cost to build | High (data team or vendor) | Lower (in-platform tools exist) |
When to Use Each
Reach for MMM when:
- You are allocating budget across channels that mix online and offline (search + TV + out-of-home)
- Your iOS or browser privacy changes have made your MTA data look suspiciously off
- Your CFO is asking for proof that brand-building spend is working, and click-based reports make it look like waste
- You are planning annual or quarterly media budgets
Reach for MTA when:
- You need to optimize campaigns in-flight this week
- You are running a pure digital performance campaign where all touchpoints can be tracked
- You want to understand which ad creative, keyword, or audience segment is converting best right now
- You are making daily or weekly bidding decisions
Use both together when:
- You want MMM to set the strategic channel budget allocations
- You want MTA to optimize how you spend within each channel day-to-day
- You want geo-based experiments to validate and calibrate both models against real-world lift
Common Mistakes
Mistake 1: Treating MTA as the single source of truth. Teams that rely exclusively on MTA, especially last-click, systematically defund brand-building channels and upper-funnel spend. Those touchpoints are invisible or underweighted in MTA. The result is short-term performance metrics that look fine while the brand slowly erodes. If your MTA report says TV and podcast spend contribute nothing, that is a data gap, not a real signal.
Mistake 2: Running MMM on too little data. MMM needs enough variation in spend over enough time to isolate channel effects. If you ran Google Ads at the same budget flat for 6 months with no changes, the model cannot distinguish its contribution from background noise. Teams that build MMM on under a year of data, or data where spend barely moved, get confidence intervals so wide the output is useless for decisions.
Pro tip, use geo-based incrementality experiments to validate both models. Run a spend-up or spend-down test in a subset of regions, measure the actual sales lift, then compare it against what MMM predicted and what MTA predicted. This triangulation reveals which model is closer to ground truth for your business. It also gives you evidence to push back when finance questions your channel mix.
Open-Source Tools Worth Knowing
In-house data science team, using Meta's open-source Robyn package BARK wanted to compare acquisition costs across Meta, Google, email, linear TV, and Amazon, and see how non-spend factors like press coverage affected subscriptions, without paying for a six-figure MMM vendor engagement BARK's data scientists built their first in-house MMM using Robyn's open-source codebase, layering in both media spend and non-spend variables
Result: 30% increase in overall subscriptions, with the full model built in about three months (Q3 2021 build, results reported afterward).
SourceThree major tech companies have released open-source MMM tools that anyone can use:
- Google Meridian: Google's open-source MMM, launched in late 2024 and now widely adopted. Designed for Bayesian modeling with geo-level data support. Free on GitHub.
- Meta Robyn: Meta's open-source MMM package (R language). Has been widely adopted since 2021 and has a large community of contributors.
- PyMC-Marketing: Python-based Bayesian MMM toolkit backed by the PyMC community. Good for teams with Python data science skills.
These tools have lowered the barrier to entry for MMM significantly, dropping the cost of entry from six-figure consulting engagements to a few weeks of in-house data-science work. A mid-size brand with a data analyst can now run a basic MMM in-house.
The One-Line Takeaway
MMM tells you where to put your money; MTA tells you how to spend it, you need both because each model is blind to exactly what the other sees.
Related Concepts
- iOS Attribution, Understanding how Apple's ATT framework broke user-level MTA and why MMM became more valuable post-iOS 14
- Bidding Strategies, MTA data feeds directly into smart bidding algorithms; knowing its limits helps you set realistic tROAS and tCPA targets
- Google Shopping & PMax, Performance Max campaigns use Google's own attribution model internally, making external MMM validation especially important for understanding true incremental contribution