ICE and RICE Prioritization
In 2025, top-performing growth teams run 40-50 experiments per quarter, yet generate 200+ ideas for every one they ship. The difference between teams that compound and teams that spin is not ideation: it is prioritization. ICE and RICE are the two scoring frameworks that separate the teams moving fast from the teams staying busy.
Quick Summary
- ICE = Impact x Confidence x Ease. Three scores from 1-10. Best for fast, reversible experiments you can ship in under a week.
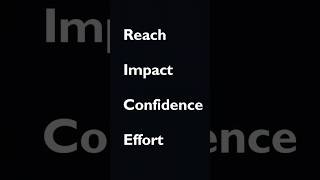
- RICE = (Reach x Impact x Confidence) / Effort. Reach is a real user count from analytics. Best when engineering time is on the line.
- A team running 25 experiments per quarter at a 25% win rate outlearns a team running 5 "sure things" every time.
- The variable most teams get wrong is Confidence. If you cannot cite a past test or benchmark, your confidence belongs below 60%.
- Activation-stage experiments deliver roughly 65% of all positive ROI across growth backlogs, so Reach on those surfaces is almost always higher than teams assume.
What It Actually Is
ICE and RICE are scoring formulas that replace gut-feel debates with a single comparable number per idea. Think of them as a shared calculator for a room full of opinions: everyone plugs in the same inputs, and the number does the arguing for you.
ICE was popularized by Sean Ellis, credited with coining the term "growth hacker," after he watched teams burn sprint cycles debating ideas no one could rank objectively. The formula is simple: Impact x Confidence x Ease, each scored 1-10. An idea with Impact 8, Confidence 7, Ease 9 scores 504.
RICE was created by Intercom product manager Sean McBride specifically because ICE had a blind spot: it could rank a feature loved by 200 power users above an onboarding fix that touches 50,000 new signups. RICE fixes this by adding Reach (real user count per quarter) and making Effort the denominator instead of a multiplier.
The analogy: ICE is a stopwatch, fast and easy to read. RICE is a GPS, slower to set up but it accounts for distance, not just speed.
Why It Matters (with data)
The 2025 Growth Experimentation Playbook benchmarks show top-performing organizations achieving 0.7-1.0 learnings per day. Roughly 70% of A/B tests fail to produce a statistically significant difference, which means learning velocity depends almost entirely on which ideas you choose to test, not how many you can run.
Activation-stage experiments consistently deliver around 65% of all positive ROI across growth backlogs, while revenue-stage tests deliver roughly 20% (Growth Experimentation Playbook 2025). A 10% improvement in activation typically lifts SaaS revenue by 12-15%. These numbers are what make Reach critical: if an onboarding screen touches 40,000 users per quarter and a settings feature touches 800, the math should win, not the loudest voice in the room.
Teams that shifted 20% of paid spend to better-scored alternative channels reported a 17% reduction in customer acquisition cost. Teams using structured prioritization systems with automation logged 35% faster experiment cycles and 60% less administrative overhead. The compounding effect across a year of structured prioritization: +18% average activation rate improvement, +22% retention improvement, +15% marketing efficiency gains (Growth Experimentation Playbook 2025).
Intercom's product team created RICE after their PMs were spending hours debating roadmap trade-offs. The framework gave them a common language across squads and cut prioritization meeting time roughly in half. The original RICE blog post is now the most-cited source in product management for quantitative prioritization, and the formula has been adopted as a default template in Atlassian, Asana, and Productboard (Whatfix: RICE Scoring Model).
How It Works / The Playbook
Step 1: Choose the right tool for the decision
Use ICE for:
- Landing page copy and layout tests
- Email subject line and CTA variants
- Ad creative experiments
- Any experiment you can ship in under a week without engineering
Use RICE for:
- Feature work competing for an engineering sprint or quarter
- Onboarding flow redesigns
- Any idea you need to defend in a roadmap review
- Decisions where Reach varies by 10x or more across the backlog
Step 2: Define your scales before the first session
Do this once and pin it to your backlog tool. Shared definitions prevent score inflation.
ICE scales:
- Impact 1 = barely measurable, 3 = noticeable 5-10% lift, 7 = meaningful metric shift, 10 = transformative
- Confidence 1-10 maps loosely to: 10 = proven by prior A/B test with significance, 7 = strong external benchmark, 5 = informed guess, 3 = pure hypothesis
- Ease 10 = can ship today, 5 = one week of work, 1 = multiple sprints
RICE scales:
- Reach = actual user count from GA4 or Mixpanel for that surface in 90 days. No estimates.
- Impact = 3 (massive), 2 (high), 1 (medium), 0.5 (low), 0.25 (minimal)
- Confidence = percentage: 100% = proven, 80% = strong precedent, 50% = guess
- Effort = person-weeks. One engineer for one week = 1. Never use days: it flattens the denominator and makes everything look cheap.
Step 3: Score independently, then reconcile
Have PM, designer, and engineer score each idea privately before the group session. Then compare scores row by row. Only discuss rows where any two people disagree by more than 2 points. That gap is where the real product conversation lives, and it surfaces assumptions faster than any brainstorm.
Step 4: Pull Reach from real analytics
Air France-KLM's cargo division digital product backlog Multiple candidate features competed for the same engineering quarter, and the team needed a defensible way to rank a flight-leg optimization feature against other requests without relying on which department argued loudest The team scored candidate features with RICE, pulling Reach from actual operational data on how many flight legs and shipments each feature would touch rather than estimating from memory
Result: The RICE-prioritized flight-leg optimization feature shipped first and reportedly saved the airline's cargo division millions of dollars in fuel costs annually (Cargo digital product prioritization cycle).
SourceThe most common RICE mistake is estimating Reach from memory. Open GA4 or your product analytics tool, filter to the specific surface or flow, and count sessions or unique users in the last 90 days. This single step prevents the entire backlog from being skewed toward features the team personally uses.
Step 5: Treat Confidence as a research queue
A low Confidence score is not a reason to kill an idea. It is a signal that the team needs a cheaper research step (a 5-person user interview, a competitor teardown, or a quick survey) before committing a sprint. Ideas below 50% Confidence go into a "research first" column, not the trash.
Step 6: Re-score after every shipped experiment
A winning test raises Confidence on adjacent hypotheses. A flat test should lower it. A scoring system that does not update from results is theater, not science. Schedule a 30-minute backlog recalibration after every four shipped experiments.
Intercom's original RICE post described a real scenario where their ICE scores kept surfacing a feature loved by a small set of power users. Once they added Reach as a variable, onboarding improvements with 40x the user exposure jumped to the top of the queue. The team reported their first RICE-ranked roadmap cut the time spent in prioritization meetings by roughly half, and the framework has since become the default template in Productboard, Asana, and Atlassian's product management toolkits.
Revenue-Weighted ICE is a 2025 refinement used by some SaaS growth teams: multiply the standard ICE score by a Revenue Weight (1x for acquisition, 1.5x for activation, 2x for retention). The logic: activation experiments deliver roughly 65% of all positive ROI, so a Revenue Weight prevents the backlog from over-indexing on top-of-funnel ideas that feel exciting but compound less.
Real Company Examples
Intercom: RICE replaces gut-feel roadmap debates (2017, ongoing)
Intercom's product roadmap prioritization meetings The team's existing scoring kept ranking a collaboration feature loved by a small, vocal power-user segment above an onboarding fix that would touch far more new signups Product managers added Reach, a real 90-day user count pulled from analytics, as a fourth variable and divided by Effort instead of multiplying by Ease, so a feature's actual audience size could outweigh internal enthusiasm
Result: The RICE-ranked backlog surfaced an onboarding simplification with roughly 40x the user exposure of the previously top-ranked feature, and the framework cut time spent in prioritization meetings roughly in half (Adopted in 2017, still Intercom's default framework).
SourceIntercom's product team built RICE after noticing that their existing scoring kept surfacing a collaboration feature that a small vocal segment loved. When they added Reach, an onboarding simplification touching tens of thousands of new users per quarter leapfrogged it. The framework was shared publicly and has since been adopted as a default scoring template in Productboard, Asana, and Atlassian. The original blog post remains the most-cited source in product management for quantitative prioritization, more than seven years after publication (Whatfix: RICE Scoring Model).
SaaS Growth Teams: Structured prioritization compounds quarter over quarter
Teams implementing structured experimentation systems using ICE or RICE as the primary backlog filter have reported consistent compounding across quarters: +18% average activation rate improvement, +22% retention improvement, and +15% marketing efficiency gains within 12 months. One specific test of shifting 20% of paid acquisition spend to an alternative channel, scored high on ICE due to low Ease cost, produced a 17% reduction in customer acquisition cost (Growth Experimentation Playbook 2025).
Product Teams Using RICE for Feature Ranking (2024-2025)
In practical RICE scoring exercises shared across product communities, a Team Collaboration feature scored 5,000 on RICE while an API Integration System scored only 600 because its Reach was limited to a technical user segment. An in-app Onboarding Flow scored 1,800. The pattern holds across companies: breadth of Reach consistently separates the top of the RICE-ranked backlog from the bottom, and the features that feel most exciting to build are rarely at the top (RICE Scoring Guide, SaasFunnelLab).
Common Mistakes
- Treating the score as the final decision. The number ranks ideas: it does not replace judgment. A 9,000-point RICE idea that conflicts with company strategy still loses to a 4,000-point idea that compounds on current momentum.
- Inflating Confidence to win the argument. If you cannot point to a prior test result, an industry benchmark, or qualitative evidence from user interviews, your Confidence score belongs below 60%. Inflated scores corrupt the entire backlog and cause the framework to lose trust within 2-3 quarters.
- Using ICE for big-bet roadmap items. Without Reach, ICE will rank a power-user feature above an onboarding fix that touches 50x more users. If engineering time is on the line, use RICE.
- Estimating Reach instead of measuring it. "About 10,000 users" and "12,847 unique sessions in GA4 last quarter" produce very different RICE scores. Pull the number from your analytics tool every time.
- Never updating scores after experiments ship. A scoring system that does not learn from results becomes political cover, not a decision tool. Schedule a quarterly calibration: compare your last 10 predicted scores against actual outcomes and adjust your scale definitions.
- Scoring Effort in days instead of person-weeks. Days flatten the denominator and make everything look cheap. A 3-day task and a 15-day task look very different in person-weeks (0.6 vs. 3) but almost identical if you say "3 days" vs. "2 weeks" in casual scoring.
Key Takeaways
- ICE is your fast-lane tool for experiments that ship in under a week: low setup cost, runs in a 45-minute meeting for 30 ideas.
- RICE is your leadership-ready tool when engineering effort is real: Reach grounds the score in actual analytics, not vibes.
- About 70% of A/B tests produce no significant result, so learning velocity depends on choosing the right ideas to test, not just running more tests.
- Treat Confidence below 50% as a research task, not a kill signal: one user interview or competitor teardown can move it to 70%.
- Activation-stage experiments generate roughly 65% of all positive growth ROI: Reach on onboarding surfaces is almost always higher than teams assume.
- Re-score after every shipped experiment or your scoring system becomes theater within two quarters.