Core Web Vitals
What They Are
Core Web Vitals are three specific numbers Google uses to judge how it actually feels to use a webpage. Not what your page says, but how fast it loads, how quickly it responds to taps and clicks, and whether things jump around while you're trying to read.
Google made these metrics an official ranking signal in 2021, meaning they now influence where your pages appear in search results.
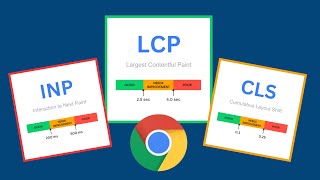
The three metrics are Largest Contentful Paint (LCP), Interaction to Next Paint (INP), and Cumulative Layout Shift (CLS). Each one measures a different kind of frustration a visitor can experience.
Quick Summary
- LCP measures how fast the main content loads, Google wants it under 2.5 seconds
- INP measures how quickly your page responds to clicks and taps, under 200 milliseconds is "Good"
- CLS measures how much your layout jumps around while loading, under 0.1 is the target
- Only 39% of websites currently pass all three thresholds, meaning there is a real competitive advantage available
- Google uses real visitor data (from Chrome users), not just your lab test scores
The Three Metrics Explained
LCP, Largest Contentful Paint
LCP is the time from when someone lands on your page to when the biggest visible element has fully loaded. This is usually your hero image, a big headline, or a video thumbnail. If LCP takes longer than 2.5 seconds, Google marks it "Poor." Between 2.5 and 4 seconds is "Needs Improvement." Under 2.5 seconds is "Good."
Think of it this way: a visitor opens your page and stares at a blank or half-loaded screen. Every second they wait, some percentage of them leave. LCP is Google's way of measuring that wait.
What causes slow LCP:
- Large, uncompressed images (the most common culprit)
- Slow server response times
- Render-blocking JavaScript (scripts that pause the page load)
- No CDN (content delivery network, which is a system of servers spread around the world to serve files faster)
INP, Interaction to Next Paint
INP replaced First Input Delay (FID) as Google's interactivity metric in March 2024. It measures the delay between a user clicking or tapping something and the page visually responding. Under 200 milliseconds is "Good." Over 500 milliseconds is "Poor."
The difference from the old metric: FID only measured the first click on a page. INP tracks every interaction throughout the session, covering every button, every dropdown, every form field. It paints a much more accurate picture of whether your site feels sluggish.
What causes poor INP:
- Heavy JavaScript running on the main thread (the browser's single-tasking lane)
- Third-party scripts like chat widgets, analytics, and ad trackers
- Large React or JavaScript framework components that run too much code on each click
CLS, Cumulative Layout Shift
a UK news publisher whose article pages were shifting more than desired as embedded tweets, videos, and widgets loaded in layout shifts from embedded content and ads were degrading the reading experience and dragging down real-user CLS scores using CrUX dashboards to measure real-user CLS, the team identified and fixed layout shifts caused by embedded code and custom widgets across article pages
Result: 75th-percentile CLS improved from 0.25 to 0.1, and the share of pages passing the 'Good' CLS threshold grew from 57% to 72% (within a couple of months).
SourceCLS measures how much your page content moves around unexpectedly as it loads. The score runs from 0 (nothing moves) upward, anything under 0.1 is "Good," over 0.25 is "Poor."
You have experienced bad CLS: you are about to tap a button and an ad appears above it, pushing everything down. You tap the wrong thing. That is a layout shift, and Google penalizes it.
What causes high CLS:
- Images and videos without defined width and height in the HTML
- Ads that load after the text content
- Web fonts that swap in and change text size
- Dynamic content injected above existing content
The 2024 metric change that matters. Google replaced First Input Delay (FID) with Interaction to Next Paint (INP) in March 2024. If your team has older reports referencing FID, those are now outdated. INP is a stricter and more comprehensive measure, a site that passed FID may now fail INP. Check your current scores in Google Search Console under the "Core Web Vitals" report.
Real Company Results
redBus, 7% sales increase from optimizing INP
The online bus ticketing platform redBus focused on reducing JavaScript execution time and optimizing event handlers to improve their Interaction to Next Paint (INP) score (which became an official Core Web Vital in March 2024). They achieved a 72% improvement in INP, which directly resulted in a 7% increase in sales.
This case study demonstrates that interactivity and page responsiveness are directly tied to user trust and checkout completion. When users click "buy" or "select seat," even minor visual lags lead to cart abandonment.
The Economic Times, 50% decrease in bounce rate
The Economic Times undertook a significant performance optimization to reduce their site-wide INP from roughly 1,000 milliseconds to 257 milliseconds.
This improvement in interactivity was linked to a 50% decrease in bounce rate and a 43% increase in pageviews. By making the site feel snappier, users remained on the page longer, consumed more content, and clicked more internal links.
Nykaa, 28% more organic traffic from LCP improvement
Nykaa, India's largest beauty e-commerce platform, improved their LCP by 40%. Organic traffic grew by 28%. This is a direct line between a technical metric and top-of-funnel marketing results: more visibility in Google search, more clicks, more potential customers.
Worked example: diagnosing a slow product page
You run an e-commerce store. Google Search Console shows your product pages are in the "Poor" bucket for LCP, average 4.8 seconds. Here is how you debug it step by step.
- Open PageSpeed Insights (pagespeed.web.dev) and paste a product URL.
- Look at the "Opportunities" section, it will list specific issues. In this example: "Properly size images" and "Eliminate render-blocking resources."
- Your product photos are 3MB JPEGs. Compress them to WebP format (a modern image format that is 25-35% smaller than JPEG at the same quality).
- One JavaScript file from a chat widget is loading before your images. Move it to load after the page (add
deferattribute or load it at the bottom of the page). - Re-run PageSpeed Insights. LCP is now 2.2 seconds, "Good."
- Wait 28 days for Google Search Console to update with real user data.
This is a realistic sequence. Steps 3 and 4 alone cover the majority of LCP issues on product pages.
How Google Actually Measures This
Google collects Core Web Vitals data from real Chrome users visiting your site. This is called "field data" or "CrUX data" (Chrome User Experience Report). It is completely separate from the scores you generate yourself in PageSpeed Insights or Lighthouse, which are "lab data."
This distinction is critical: your ranking is determined by field data, not lab data. A site can score 95 in Lighthouse and still show "Poor" in Search Console if the CDN is slow, if users are on slower devices, or if traffic is mostly from regions far from your server.
You need both:
- Search Console (search.google.com/search-console): Shows field data across your entire site, grouped by URL type (product pages, blog posts, etc.). Use it to find which page templates have the most "Poor" URLs.
- PageSpeed Insights (pagespeed.web.dev): Shows both field and lab data for a single URL. Use it to diagnose specific issues after Search Console tells you where the problems are.
Why This Matters for Marketers (Not Just Developers)
a global telecom running paid landing-page traffic across display, search, and social the marketing team wanted to know whether Web Vitals optimization actually moved business metrics, not just lab scores Vodafone A/B tested a landing page optimized for Web Vitals (31% better LCP) against an unoptimized version, both receiving roughly 100K clicks and 34K visits a day
Result: the Web-Vitals-optimized version drove 8% more sales, a 15% lift in lead-to-visit rate, and an 11% improvement in cart-to-visit rate (over the course of the A/B test).
SourceMost marketing teams hand Core Web Vitals over to the dev team and never think about it again. That is a mistake. Here is why marketers specifically need to own these numbers.
Paid ads: Google's Quality Score for landing pages is partly based on page experience signals. A landing page that fails Core Web Vitals can have a higher cost-per-click than a competitor running the same keywords with a faster page. You are literally paying more per click because of a technical issue.
Conversion rate: Pages with poor LCP see 20-40% lower conversions on average according to 2024 industry research. If your checkout page loads in 5 seconds on mobile, you are losing sales regardless of how good the offer is.
The Mobile and Competitive Picture
Mobile traffic: Mobile devices account for more than 60% of most sites' traffic. Core Web Vitals scores on mobile are almost always worse than on desktop, due to more weight, slower connections, and less processing power. The mobile scores in Search Console are what matter most.
Competitive window: Only 39% of websites pass all three Core Web Vitals thresholds. If your competitors are in the failing 61%, fixing your own metrics gives you a ranking edge with zero content changes needed.
The most common Core Web Vitals mistake: fixing only the homepage.
Search Console's Core Web Vitals report groups URLs by template type, blog posts, product pages, category pages, checkout. Teams optimize the homepage, see a green checkmark, and stop. Meanwhile, the blog posts and product detail pages that drive 80% of organic traffic stay in "Poor."
Always check the URL groups breakdown in Search Console. Sort by volume of affected pages, not by which page feels most important. Fixing one product page template can move thousands of URLs from "Poor" to "Good" at once.
Priority Fixes by Metric
LCP Fixes (highest impact first)
- Compress and convert images to WebP or AVIF format. A 3MB JPEG becoming a 400KB WebP is the single highest-impact change most sites can make.
- Add
fetchpriority="high"to your hero image so the browser loads it before other images. - Use a CDN to serve files from a server close to the user.
- Preconnect to third-party domains your hero image depends on (e.g., a cloud image service).
INP Fixes (highest impact first)
- Audit third-party scripts. Run PageSpeed Insights and look at "Third-party code" in the diagnostics. Remove or delay scripts you do not actively use.
- Break up long JavaScript tasks into smaller chunks so the browser can respond to user input in between.
- Defer non-critical JavaScript using the
deferorasyncattribute.
CLS Fixes (highest impact first)
- Add explicit
widthandheightattributes to every<img>tag. This is the fastest fix and prevents most layout shifts from images. - Reserve space for ads using
min-heighton the ad container before the ad loads. - Use
font-display: optionalfor web fonts to prevent text from jumping when a custom font swaps in.
The One-Line Takeaway
Core Web Vitals are the only ranking factor you can improve without writing a single word of content, fix LCP, INP, and CLS and you unlock ranking gains that better writing alone cannot deliver.
Related Concepts
- Technical SEO, Core Web Vitals are a subset of technical SEO; fixing them requires server, code, and infrastructure access that broader technical audits also demand.
- E-E-A-T, Google's quality evaluation framework works alongside page experience signals; strong E-E-A-T content on a slow page still faces a ranking disadvantage.
- AI Overviews and GEO, As AI Overviews absorb more informational clicks, page experience metrics become more important for the transactional and navigational traffic that still drives click-throughs.