Marketing Math: CAC, LTV, ROAS, Payback
What It Is
Every marketing decision comes down to four numbers: how much it costs to get a customer, how much that customer is worth over time, how much revenue your ads return, and how long until you break even. Master these four and you can defend any budget in any boardroom. Miss them and you are guessing with someone else's money.
Quick Summary
- CAC (Customer Acquisition Cost) is the total cost, ads, salaries, tools, to win one paying customer.
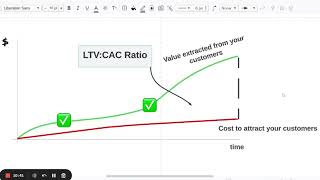
- LTV (Lifetime Value) is the gross profit you expect from that customer over their full relationship with you.
- ROAS (Return on Ad Spend) is revenue divided by ad spend for a campaign, a fast, short-horizon efficiency check.
- Payback period is how many months it takes for a customer's margin to cover what you spent acquiring them.
- A healthy business targets LTV:CAC above 3:1 and payback under 18 months.
Why These Numbers Matter
The era of "growth at all costs" is over. iOS 14.5 (2021) shattered last-click attribution (the old method of giving 100% credit to the final ad a user clicked). Meta CPMs (cost per 1,000 ad impressions) rose 89% between 2020 and 2023. Zero-interest-rate free money dried up. Boards now ask for unit economics, CAC, LTV, and payback, before approving budget. The marketers who speak this language control the budget.
Here is why each metric earns its place:
- It decides budget. CFOs cut channels with bad payback first. Knowing your numbers is how marketing keeps its seat at the table.
- It exposes channel lies. A campaign showing 8x ROAS on a 14-day window can still lose money once refunds, cost of goods sold (COGS, what it costs to make or deliver the product), and churn (customers who stop buying) are factored in honestly.
- It aligns marketing with finance. CAC and payback bridge the gap between your dashboards and the profit-and-loss statement (P&L) your CFO actually reads.
- It tells you which lever to pull. If LTV is low, the fix is usually retention or price, not more ads. The math tells you where to look.
The Four Formulas
1. CAC, Customer Acquisition Cost
Formula: CAC = Total Sales and Marketing Spend / New Customers Acquired
"Total spend" means everything: ad spend, agency fees, marketing salaries, sales team salaries, CRM (customer relationship management) tools, and any other cost that exists to win new business. Divide by the number of new paying customers you brought in during the same period.
2024 industry benchmarks (average CAC):
- SaaS (Software as a Service): $205
- Retail: $87
- Fashion: $129
- E-commerce average: $70
The most common CAC mistake: Using "paid CAC", just ad spend divided by customers, and ignoring salaries, agencies, and tools. Fully loaded CAC is typically 2 to 3 times the ad-spend-only number. If your dashboard says CAC is $50 but you have a $15,000/month marketing manager and a $5,000/month agency, your real CAC is much higher.
2. LTV, Lifetime Value (also called CLV or Customer Lifetime Value)
Formula: LTV = (Average Revenue per Customer x Gross Margin %) x Average Customer Lifetime
For subscription businesses: LTV = (Monthly Revenue per Customer x Gross Margin %) / Monthly Churn Rate
Gross margin (the percentage of revenue left after subtracting what it costs to deliver the product) is the critical word here. A $100 customer with 20% gross margins is worth $20 to your business, not $100.
The LTV mistake that kills fundraising pitches: Plugging top-line revenue into LTV instead of gross profit. This produces a flattering 8:1 ratio that evaporates the moment a finance-literate investor opens a spreadsheet. Always use gross profit, not revenue.
3. ROAS, Return on Ad Spend
Formula: ROAS = Revenue Generated by Ads / Ad Spend
A 4:1 ROAS means $4 of revenue for every $1 spent on ads. This is a fast read on campaign efficiency. It is gross revenue, not profit, and it ignores everything that happens after the first purchase. Think of ROAS as the speedometer, useful, but not the destination.
2025 benchmarks:
- Median ROAS across e-commerce brands on Triple Whale (a major analytics platform): 2.04
- E-commerce brands typically target 4:1
- B2B services often accept 2:1 because their customer lifetime is longer
- Google Ads average conversion rate across all industries in 2025: 7.52%
Platform ROAS inflation warning: A 2025 analysis of 200+ e-commerce brands found that marketing platforms overstate true ROAS by an average of 2.3 times. Meta was found to inflate ROAS for Shop ads by counting shipping fees as revenue, boosting reported results by 17 to 19%. Always cross-check platform-reported ROAS against your own revenue data.
4. Payback Period
Formula: Payback Period (months) = CAC / Monthly Gross Profit per Customer
Payback period tells you how many months of margin you need before that customer's gross profit covers what you spent acquiring them. A 12-month payback means you are cash-negative on that customer for a full year.
2025 benchmarks:
- Ideal for SaaS: under 12 months
- Median SaaS payback in 2025: approximately 20 months (up from the historical 12 to 18 month band, driven by higher paid-media costs and longer sales cycles)
- If payback exceeds 18 months and LTV:CAC is below 3:1, you have a unit economics problem, not a marketing problem
How the Four Metrics Work Together
The workflow in plain English:
- Calculate your fully loaded CAC. Compare it to sector benchmarks.
- Calculate LTV using gross profit, not revenue.
- Divide LTV by CAC. Target 3:1 or above.
- Divide CAC by monthly gross profit per customer to get payback. Target under 18 months.
- If either ratio is unhealthy, fix unit economics before increasing spend.
Real-World Examples
HubSpot's 2024 annual report showed $2.63 billion in revenue and $1.27 billion in sales and marketing spend, roughly 48% of revenue. Most companies would panic at that ratio. HubSpot's board approved it because the math holds: Net Revenue Retention (NRR, the percentage of last year's revenue still active this year, counting expansions) sat at approximately 102%, meaning existing customers slightly increased their spend year over year. Gross margins were above 84%. With those inputs, payback sits in the 20 to 24 month range and implied LTV:CAC comfortably clears 3:1. The heavy spend line is sustainable because every dollar invested returns more than three dollars in lifetime gross profit.
A 2025 analysis of over 200 e-commerce brands found that ad platforms overstate true ROAS by an average of 2.3 times. One specific finding: Meta was counting shipping fees as revenue in Shop ads, inflating reported ROAS by 17 to 19%. A brand that thought it was running a 4:1 ROAS campaign was actually running closer to 2:1 once clean data was applied. The lesson: brands that set up independent tracking and cross-checked platform data against their own revenue records cut wasted ad spend by an average of 27%.
Common Mistakes (and How to Avoid Them)
Mistake 1, Revenue instead of gross profit in LTV. A $100 customer with 20% margins is worth $20, not $100. This single error produces inflated LTV:CAC ratios that fall apart in finance reviews.
Mistake 2, Excluding salaries and tools from CAC. "Ad spend / customers" is not CAC. It is paid CAC, which ignores the people, agencies, and software that make the ads work. Fully loaded CAC is usually 2 to 3 times higher.
Mistake 3, Trusting platform-reported ROAS without verification. Platform ROAS is measured differently by every platform, often in ways that favor their own numbers. Cross-check against actual revenue in your own systems.
Mistake 4, Using company-wide averages instead of channel cohorts. One efficient channel can hide two leaky ones in blended averages. Break CAC and payback down by channel. When you cut the leaky ones, blended CAC typically drops 30 to 50% without losing meaningful revenue.
A Simple Worked Example
Imagine a B2B SaaS company with these inputs:
| Input | Value |
|---|---|
| Total sales and marketing spend (monthly) | $100,000 |
| New customers this month | 50 |
| Average monthly revenue per customer | $200 |
| Gross margin | 75% |
| Monthly churn rate | 2% |
Step 1, CAC: $100,000 / 50 = $2,000 per customer
Step 2, LTV: ($200 x 75%) / 2% = $150 / 0.02 = $7,500
Step 3, LTV:CAC: $7,500 / $2,000 = 3.75:1 (healthy, above the 3:1 benchmark)
Step 4, Payback: $2,000 / ($200 x 75%) = $2,000 / $150 = 13.3 months (healthy, below 18 months)
Verdict: this company is in good shape. It has room to scale spend carefully.
Pro Tips
Track by cohort, not company average. Group customers by the month they signed up and track their retention, revenue, and margin over time. Cohort analysis shows whether your newer customers are as valuable as your older ones, or whether acquisition quality is declining as you scale.
Attribution affects every number in this framework. If your attribution model gives all credit to the last click before purchase, your CAC for top-of-funnel channels (content, social, brand awareness) will look sky-high, and you will cut them. Companies that switched to multi-touch attribution (spreading credit across all touchpoints a customer interacted with) improved cost per acquisition efficiency by 14 to 36%, according to 2025 data.
The One-Line Takeaway
ROAS tells you if a campaign worked this week; LTV:CAC and payback tell you if the business will still exist in three years.
Related Concepts
- Customer Lifetime Value (CLV), the deeper dive into the LTV side of the equation, and why email and retention is the cheapest way to grow it.
- Attribution Models, your ROAS number is only as honest as the attribution model behind it.
- Retention Cohorts, cohort retention is the input that makes LTV (and therefore payback) believable.